Wednesday, September 20, 2017

How to Build a React App that Works with a Rails 5.1 API

React + Ruby on Rails = 🔥

React has taken the frontend development world by storm. It's an excellent JavaScript library for building user interfaces. And it's great in combination with Ruby on Rails. You can use Rails on the back end with React on the front end in various ways.

In this hands-on tutorial, we're going to build a React app that works with a Rails 5.1 API.

You can watch a video version of this tutorial here.

Watch a video version of this tutorial

To follow this tutorial, you need to be comfortable with Rails and know the basics of React.

[affiliate-section title="Recommended Courses"][affiliate-card title="The Best Way to Learn React for Beginners" affiliatename="Wes Bos" text="A step-by-step training course to get you building real world React.js + Firebase apps and website components in a couple of afternoons. Use coupon code 'SITEPOINT' at checkout to get 25% off." url="http://ift.tt/2tF1ast" imageurl="http://ift.tt/2y2HI7v"][/affiliate-section]

If you don't use Rails, you can also build the API in the language or framework of your choice, and just use this tutorial for the React part.

The tutorial covers stateless functional components, class-based components, using Create React App, use of axios for making API calls, immutability-helper and more.

What We're Going to Build

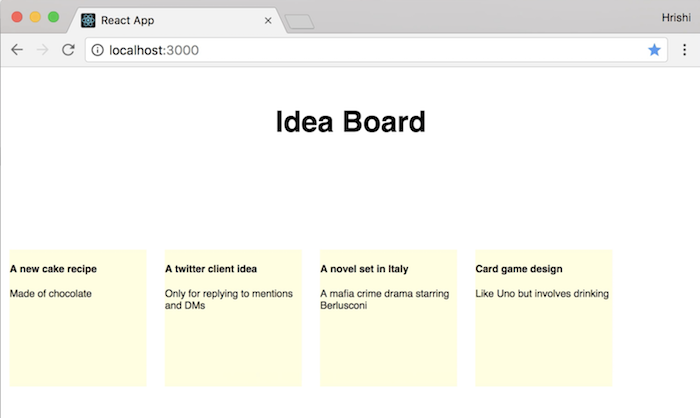
We're going to build an idea board as a single page app (SPA), which displays ideas in the form of square tiles.

You can add new ideas, edit them and delete them. Ideas get auto-saved when the user focuses out of the editing form.

A demo of the Idea board app

At the end of this tutorial, we'll have a functional CRUD app, to which we can add some enhancements, such as animations, sorting and search in a future tutorial.

You can see the full code for the app on GitHub:

Ideaboard Rails API

Ideaboard React frontend

Setting up the Rails API

Let's get started by building the Rails API. We'll use the in-built feature of Rails for building API-only apps.

Make sure you have version 5.1 or higher of the Rails gem installed.

gem install rails -v 5.1.3

At the time of writing this tutorial, 5.1.3 is the latest stable release, so that's what we'll use.

Then generate a new Rails API app with the --api flag.

rails new --api ideaboard-api
cd ideaboard-api

Next, let's create the data model. We only need one data model for ideas with two fields --- a title and a body, both of type string.

Let's generate and run the migration:

rails generate model Idea title:string body:string

rails db:migrate

Now that we've created an ideas table in our database, let's seed it with some records so that we have some ideas to display.

In the db/seeds.rb file, add the following code:

ideas = Idea.create(
  [
    {
      title: "A new cake recipe",
      body: "Made of chocolate"
    },
    {
      title: "A twitter client idea",
      body: "Only for replying to mentions and DMs"
    },
    {
      title: "A novel set in Italy",
      body: "A mafia crime drama starring Berlusconi"
    },
    {
      title: "Card game design",
      body: "Like Uno but involves drinking"
    }
  ])

Feel free to add your own ideas.

Then run:

rails db:seed

Next, let's create an IdeasController with an index action in app/controllers/api/v1/ideas_controller.rb:

module Api::V1
  class IdeasController < ApplicationController
    def index
      @ideas = Idea.all
      render json: @ideas
    end
  end
end

Note that the controller is under app/controllers/api/v1 because we're versioning our API. This is a good practice to avoid breaking changes and provide some backwards compatibility with our API.

Then add ideas as a resource in config/routes.rb:

Rails.application.routes.draw do
  namespace :api do
    namespace :v1 do
      resources :ideas  
    end
  end
end

Alright, now let's test our first API endpoint!

First, let's start the Rails API server on port 3001:

rails s -p 3001

Then, let's test our endpoint for getting all ideas with curl:

curl -G http://localhost:3001/api/v1/ideas

And that prints all our ideas in JSON format:

[{"id":18,"title":"Card game design","body":"Like Uno but involves drinking","created_at":"2017-09-05T15:42:36.217Z","updated_at":"2017-09-05T15:42:36.217Z"},{"id":17,"title":"A novel set in Italy","body":"A mafia crime drama starring Berlusconi","created_at":"2017-09-05T15:42:36.213Z","updated_at":"2017-09-05T15:42:36.213Z"},{"id":16,"title":"A twitter client idea","body":"Only for replying to mentions and DMs","created_at":"2017-09-05T15:42:36.209Z","updated_at":"2017-09-05T15:42:36.209Z"},{"id":15,"title":"A new cake recipe","body":"Made of chocolate","created_at":"2017-09-05T15:42:36.205Z","updated_at":"2017-09-05T15:42:36.205Z"}]

We can also test the endpoint in a browser by going to http://localhost:3001/api/v1/ideas.

Testing our API endpoint in a browser

Setting up Our Front-end App Using Create React App

Now that we have a basic API, let's set up our front-end React app using Create React App. Create React App is a project by Facebook that helps you get started with a React app quickly without any configuration.

First, make sure you have Node.js and npm installed. You can download the installer from the Node.js website. Then install Create React App by running:

npm install -g create-react-app

Then, make sure you're outside the Rails directory and run the following command:

create-react-app ideaboard

That will generate a React app called ideaboard, which we'll now use to talk to our Rails API.

Let's run the React app:

cd ideaboard
npm start

This will open it on http://localhost:3000.

Homepage of a new app generated by Create React App

The app has a default page with a React component called App that displays the React logo and a welcome message.

The content on the page is rendered through a React component in the src/App.js file:

import React, { Component } from 'react'
import logo from './logo.svg'
import './App.css'

class App extends Component {
  render() {
    return (
      <div className="App">
        <div className="App-header">
          <img src={logo} className="App-logo" alt="logo" />
          <h2>Welcome to React</h2>
        </div>
        <p className="App-intro">
          To get started, edit <code>src/App.js</code> and save to reload.
        </p>
      </div>
    );
  }
}

export default App

Our First React Component

Our next step is to edit this file to use the API we just created and list all the ideas on the page.

Let's start off by replacing the Welcome message with an h1 tag with the title of our app 'Idea Board'.

Let's also add a new component called IdeasContainer. We need to import it and add it to the render function:

import React, { Component } from 'react'
import './App.css'
import IdeasContainer from './components/IdeasContainer'

class App extends Component {
  render() {
    return (
      <div className="App">
        <div className="App-header">
          <h1>Idea Board</h1>
        </div>
        <IdeasContainer />
      </div>
    );
  }
}

export default App

Let's create this IdeasContainer component in a new file in src/IdeasContainer.js under a src/components directory.

import React, { Component } from 'react'

class IdeasContainer extends Component {
  render() {
    return (
      <div>
        Ideas
      </div>
    )
  }
}

export default IdeasContainer

Let's also change the styles in App.css to have a white header and black text, and also remove styles we don't need:

.App-header {
  text-align: center;
  height: 150px;
  padding: 20px;
}

.App-intro {
  font-size: large;
}

Skeleton Idea board app

This component needs to talk to our Rails API endpoint for getting all ideas and display them.

Fetching API Data with axios

We'll make an Ajax call to the API in the componentDidMount() lifecycle method of the IdeasContainer component and store the ideas in the component state.

Let's start by initializing the state in the constructor with ideas as an empty array:

constructor(props) {
  super(props)
  this.state = {
    ideas: []
  }
}

And then we'll update the state in componentDidMount().

Let's use the axios library for making the API calls. You can also use fetch or jQuery if you prefer those.

Install axios with npm:

npm install axios --save

Then import it in IdeasContainer:

import axios from 'axios'

And use it in componentDidMount():

componentDidMount() {
  axios.get('http://localhost:3001/api/v1/ideas.json')
  .then(response => {
    console.log(response)
    this.setState({ideas: response.data})
  })
  .catch(error => console.log(error))
}

Now if we refresh the page … it won't work!

No Access-Control-Allow-Origin header present

We'll get a "No Access-Control-Allow-Origin header present" error, because our API is on a different port and we haven't enabled Cross Origin Resource Sharing (CORS).

Enabling Cross Origin Resource Sharing (CORS)

So let's first enable CORS using the rack-cors gem in our Rails app.

Add the gem to the Gemfile:

gem 'rack-cors', :require => 'rack/cors'

Install it:

bundle install

Then add the middleware configuration to config/application.rb file:

config.middleware.insert_before 0, Rack::Cors do
  allow do
    origins 'http://localhost:3000'
    resource '*', :headers => :any, :methods => [:get, :post, :put, :delete, :options]
  end
end

We restrict the origins to our front-end app at http://localhost:3000 and allow access to the standard REST API endpoint methods for all resources.

Now we need to restart the Rails server, and if we refresh the browser, we'll no longer get the CORS error.

The page will load fine and we can see the response data logged in the console.

Ideas JSON response from API logged to the console

So now that we know we're able to fetch ideas from our API, let's use them in our React component.

We can change the render function to iterate through the list ideas from the state and display each of them:

render() {
  return (
    <div>
      {this.state.ideas.map((idea) => {
        return(
          <div className="tile" key={idea.id} >
            <h4>{idea.title}</h4>
            <p>{idea.body}</p>
          </div>
        )       
      })}
    </div>
  );
}

That will display all the ideas on the page now.

List of ideas displayed by component

Note the key attribute on the tile div.

We need to include it when creating lists of elements. Keys help React identify which items have changed, are added, or are removed.

Now let's add some styling in App.css to make each idea look like a tile:

.tile {
  height: 150px;
  width: 150px;
  margin: 10px;
  background: lightyellow;
  float: left;
  font-size: 11px;
  text-align: left;
}

We set the height, width, background color and make the tiles float left.

Styled idea tiles

Stateless functional components

Before we proceed, let's refactor our code so far and move the JSX for the idea tiles into a separate component called Idea.

import React from 'react'

const Idea = ({idea}) =>
  <div className="tile" key={idea.id}>
    <h4>{idea.title}</h4>
    <p>{idea.body}</p>
  </div>

export default Idea

This is a stateless functional component (or as some call it, a "dumb" component), which means that it doesn't handle any state. It's a pure function that accepts some data and returns JSX.

Then inside the map function in IdeasContainer, we can return the new Idea component:

{this.state.ideas.map((idea) => {
  return (<Idea idea={idea} key={idea.id} />)
})}

Don't forget to import Idea as well:

import Idea from './Idea'

Great, so that's the first part of our app complete. We have an API with an endpoint for getting ideas and a React app for displaying them as tiles on a board!

Adding a new record

Next, we'll add a way to create new ideas.

Let's start by adding a button to add a new idea.

Inside the render function in IdeasContainer, add:

<button className="newIdeaButton">
  New Idea
</button>

And let's add some styling for it in App.css:

.newIdeaButton {
  background: darkblue;
  color: white;
  border: none;
  font-size: 18px;
  cursor: pointer;
  margin-right: 10px;
  margin-left: 10px;
  padding:10px;
}

New Idea button

Now when we click the button, we want another tile to appear with a form to edit the idea.

Once we edit the form, we want to submit it to our API to create a new idea.

Continue reading %How to Build a React App that Works with a Rails 5.1 API%


by Hrishi Mittal via SitePoint

#308: W3C Standardizes DRM

Frontend Focus
Issue 308 — September 20, 2017
This decision has resulted in the EFF resigning from the consortium due to a belief that the W3C process is no longer suited to defending the open web.
Cory Doctorow

François Poizat looks at how variable & parametric fonts will revolutionize responsive type.
Smashing Magazine

A big update to this popular guide for getting your CSS behaving in a range of email clients.
Campaign Monitor

Get a Linode server up and running in seconds. Simply choose your plan, distro and location and you’re ready to deploy your server. Use promo code HTML520 for a $20 credit on a new account.
Linode Cloud Hosting   Sponsor

The Web Payments Working Group has advanced both Payment Request API and Payment Method identifiers to Candidate Recommendation Status.
W3C

A future version of Chrome may force all domains ending on .dev (and .foo) to be redirected to HTTPs via a preloaded HTTP Strict Transport Security (HSTS) header.
Mattias Geniar

Techniques, considerations, and approaches that will help you write more accessible CSS.
Manuel Matuzovic

An in-depth look at the coding process for The Global Upvote, a site which brings together the top voted stories from across the web, updated every 60 seconds.
James Y Rauhut

A look at a non-standard attribute supported by Chrome, Firefox and Edge for allowing the selection of an entire directory via a form.
Vitaly Friedman

Jobs

Can't find the right job? Want companies to apply to you? Try Hired.com.

In Brief

W3C Publishes Encrypted Media Extensions as a W3C Recommendation news
W3C

Building The DOM Faster: Speculative Parsing, Async, Defer and Preload tutorial
How browsers interpret code and how they help load pages faster with speculative parsing.
Milica Mihajlija

Taking CSS Linting to the Next Level with Stylelint tutorial
Ashley Nolan introduces the features of stylelint, a flexible and well-supported CSS linting tool that can improve your code style/maintenance.
SitePoint

Building a multiplayer game with Angular and Pusher tutorial
Learn how to build a realtime Angular game from scratch, taking advantage of the awesome realtime capabilities with Pusher.
Pusher  Sponsor

Basic Grid Layout with Fallbacks using Feature Queries tutorial
Chen Hui Jing

'The Notch' (on iPhone X) and CSS tutorial
Chris Coyier

Chrome Extensions for Quick Site Redesigns tutorial
How one developer uses Chrome extensions to do quick site redesigns.
Monica Dinculescu

Building Inclusive Toggle Buttons tutorial
Heydon Pickering

CSS Grid: Bringing True 2D Layout to the Web video
Melanie Richards

Microsoft Edge Web Summit 2017 Roundup video
All of the recorded sessions from the recent Edge Summit are now available (with slides and captions).
Channel 9

Running a Performance Profile on the YouTube Search Box with DevTools video
Umar Hansa

I Don’t Know Who The Web Audio API Is Designed For opinion
“The scope of Web Audio is hopelessly huge, with features I can’t imagine anybody using, core abstractions that are hopelessly expensive, and basic functionality basically missing.”
Jasper St. Pierre

Create Beautiful, Dynamic React Apps with a Single Component Library - Try ExtReact for Free Today tools
Sencha, Inc.  Sponsor

luma.gl: A JS WebGL2 Framework for Data Visualization code
Uber


by via Frontend Focus

Embedded Signing with the HelloSign API

In less than 4 minutes, we'll walk you through a live embedded signature demonstration. Watch as we embed a signature request from our own example site using HTML and PHP. Prefer to use another language? No problems, HelloSign also has integration code available for Node.js, Ruby, Python, Java, C# and cURL. With additional branding and customization options available, it's clear to see why signing with HelloSign is easy.

Continue reading %Embedded Signing with the HelloSign API%


by Angela Molina via SitePoint

Blendmodes Studio

Slick load transition in this One Pager for Blendmodes Studio featuring an impressive showreel of their work. Nice touch having the user hold the spacebar to view the video, increasing engagement with the content.

Full Review | Direct Link


by Rob Hope @robhope via One Page Love

What Is a Good Creative Brief for a Video? [Infographic]

The creative brief is what we rely on to get up to speed and understand what it is we’re making a video about. In most cases our entire process is completed in 4-6 weeks, which means in most cases we get about a week to understand as much about the product or service as we can. The client by...

[ This is a content summary only. Visit our website http://ift.tt/1b4YgHQ for full links, other content, and more! ]

by Web Desk via Digital Information World

20 Limit

Useful One Pager helping writers stick to (the recommended) 20 word maximum length sentences. The blue is a tad harsh on a Retina display but I enjoy seeing more-and-more Single-Serving One Pagers like these out there.


by Rob Hope @robhope via One Page Love

Create Interactive Charts Using Plotly.js, Part 3: Bar Charts

In our last tutorial, you learned how to create line charts in Plotly.js. Every aspect of line charts, like the data to be plotted and the shape or color of the line connecting the plotted points, can be controlled using a set of attributes. Plotly.js allows you to create bar charts in a similar manner. 

In this tutorial, you will learn how to create different kinds of bar charts using Plotly.js. I will also discuss how to control the appearance of these charts, like the bar color and width, using specific attributes.

Before going further, I would like to mention that you can also create some basic bar charts using Chart.js. If you don't plan on using any of the fancy features of Plotly.js, using a lightweight library makes more sense.

Creating Your First Bar Chart

You can plot a bar chart in Plotly.js by setting the value of the type attribute to bar. The rest of the tasks, like creating a trace object or providing the data to be plotted, are similar to the process of creating line charts. Here is the code you need to create a basic bar chart in Plotly.

Here is the chart created by the above code. The planet density data has been taken from the Planetary Fact Sheet provided by NASA. 

Creating Stacked, Grouped, and Relative Bar Charts

If you need to represent more complex data in the form of a chart, you can use the barmode attribute available in Plotly to do so. This attribute can be set to stack, group, overlay, and relative. It's usually helpful if you want to plot multiple bar traces with related information.

The stack value creates stacked bar charts in which bars representing the subgroups of the entity are placed on top of each other to form a single column. All the bars within a subgroup have different colors that show the individual contribution of that section to the whole entity. The combined length of the stacked bars represents the total size of that entity.

Here is some code that stacks the GDP contribution of the top eight countries together. The Nominal GDP sector composition data has been taken from Wikipedia.

The stacking order for the subgroups depends on the order in which the data was passed to the function.

Setting the barmode to overlay will place the individual bars in subgroups over one another. While this mode can be useful for direct comparisons, you should be careful with it because it will hide shorter bars that were passed earlier in the plot() function. 

The following chart has been created with barmode set to overlay. You can now easily compare the GDP contribution of a single sector across all countries with ease. It is worth noting that all the bars of a single country now start from the bottom. This makes a few observations very easy to spot. For example, it is now very clear that GDP of service sector > GDP of industrial sector > GDP of agricultural sector in all of the top eight countries. 

At the current scale, it is impossible to properly see the contribution of the agricultural sector in the GDP of Germany, United Kingdom, and France. The ability of Plotly.js to zoom in can prove very useful in such cases. You can zoom in as much as you want, and the chart will still be very sharp.

Instead of stacking all the bars of a subgroup on top of each other, you can also place them together to form a group. You will have to set the barmode to group to create grouped charts. Keep in mind that providing too much information in grouped charts can make them hard to read. 

You can control the space between bars from different categories as well as bars within a subgroup using the bargap and bargroupgap attributes respectively. Up to this point, the bars were all drawn in order to plot the actual GDP numbers. However, you can use the barnorm parameter to draw the bars in terms of percentages or fractions. When barnorm is set to percentage or fraction, the total contribution of the main category is calculated, and then a percentage is allotted to individual bars based on the subgroup value.

For example, the service sector contributes about 79.7% to the total GDP of United States. This means that the bar for service sector in case of United states will be drawn up to the 79.7 mark. All these attributes discussed in this paragraph are specified in the layout object. Here is an example of the layout object that specifies all these parameters.

The final barmode value called relative is useful when you are plotting a group of traces with both negative and positive values. In this case, the positive values are drawn above the axis and negative values are drawn below the axis.

Changing the Bar Color, Width, Text, and Other Attributes

It is possible to change the color of bars in a trace using the color attribute nested inside the marker parameter. The color and width of the bar outline can be changed in a similar manner. These options are nested inside the line attribute, which itself is nested inside marker. Each of these options can be supplied either as a single value to specify the color and width of all the bars in a trace at once or as an array to specify a different color or width for individual bars.

Another important attribute that you might find useful is base. It allows you to specify the position where the base of a bar is drawn. It can be helpful in certain situations where you are posting relative values that need to be offset to show the right result. 

Additional information can be provided about a specific bar or plotted point using the text attribute. The position of the text can be specified using inside, outside, auto, and none. When inside is used, the text will be positioned inside the bar near its end. The text itself can be scaled and rotated so that it fits properly inside the bar. When outside is used, the text will be placed outside the bar near its end. In this case, the text will only be scaled. When no value has been set for the hovertext attribute, the value of text is shown inside the hover labels as well. 

You can also use different font families for text lying inside as well as outside the bar using the insidetextfont and outsidetextfont attributes.

Here is an example of using all these attributes to create a chart that plots the relative speed of different vehicles, with a single moving vehicle as a reference.

As you can see, I have passed the base and color values as an array. When vehicles are going in the same direction, they appear to be moving slower, so we need to add the speed of our own vehicle as a base value to get the actual speed. 

When vehicles are going in the opposite direction, they appear to be moving fast, so we need to subtract the speed of our own vehicle to get an accurate result. This allows us to show additional information about the speed of our own vehicle on the same plot. The following CodePen example shows the final chart plotted by the above code.

Conclusion

This tutorial showed you how to create a variety of bar charts in Plotly.js using the barmode attribute. You also learned how to customize the appearance of individual bars in a chart using a specific set of attributes. I have tried to cover all the commonly used attributes of bar charts in the tutorial. 

However, there are still a few additional attributes that you can read about in the bar trace reference section on Plotly. Some attributes that I have explained in the tutorial are missing from the reference section, but they can be found in the source files of the library if you are interested in learning more about them.

If you have any questions or suggestions related to this tutorial, feel free to let me know in the comments.


by Monty Shokeen via Envato Tuts+ Code