This article was created in partnership with WRLD. Thank you for supporting the partners who make SitePoint possible.
We’re just about wrapping up our series on the WRLD platform. So far, we’ve looked at how to use WRLD with outside maps. In this tutorial, we’re going to design and use an indoor map (also known as a floorplan, if you're going to be pedantic about it like a Dwight Schrute). As you might be able to tell, I think The Office would be a good theme for this one. Let us start off with a quote:
Would I ever leave this company? Look, I’m all about loyalty. In fact, I feel like part of what I’m being paid for here is my loyalty. But if there were somewhere else that valued loyalty more highly… I’m going wherever they value loyalty the most. – Dwight K. Schrute
In this tutorial, we’re going to cover the following topics:
- Creating an indoor map
- Importing the map into WRLD
- Highlighting specific rooms
- Creating a schedule and looping through it
The code for this tutorial has been tested with a modern version of Chrome.
Creating Indoor Maps
We’re going to try and re-create the office, from The Office. I think it’s going to be a bit of a fun challenge. We’ll start by installing some software. I’m on a Mac, so these are the instructions for how to do it on a Mac. Apparently, it’s a lot simpler on Windows…
The first bit of software we need is called QGIS. You can download it directly from their site, but the Mac link goes off-site to a rather dodgy looking place. I’m a bit more trusting with software I can install through Homebrew, because I can see what it’s doing at each step of the way. If you are on a Mac, and you haven’t already got Homebrew, I suggest you install it. Once that’s done, you can start the QGIS installation via some Python packages:
brew install gdal
brew install python
When I tried installing
python, Homebrew told me I already had Python installed. However, thepipcommand was missing. I had to reinstallpython, usingbrew reinstall python; and then I had to re-link it, usingbrew unlink python && brew link python. After this, I had thepipcommand.
You can follow this up with:
pip install matplotlib
pip install psycopg2
brew tap osgeo/osgeo4mac
brew install qgis2
All of this works, at the time of writing. That’s no guarantee that it’ll work by the time you read this. You may have to resort to the seemly official, yet utterly dodgy-looking QGIS download site I mentioned earlier.
I learned of this process from a tutorial, about installing QGIS through Homebrew.
After all that, you should be able to run the qgis2 command…
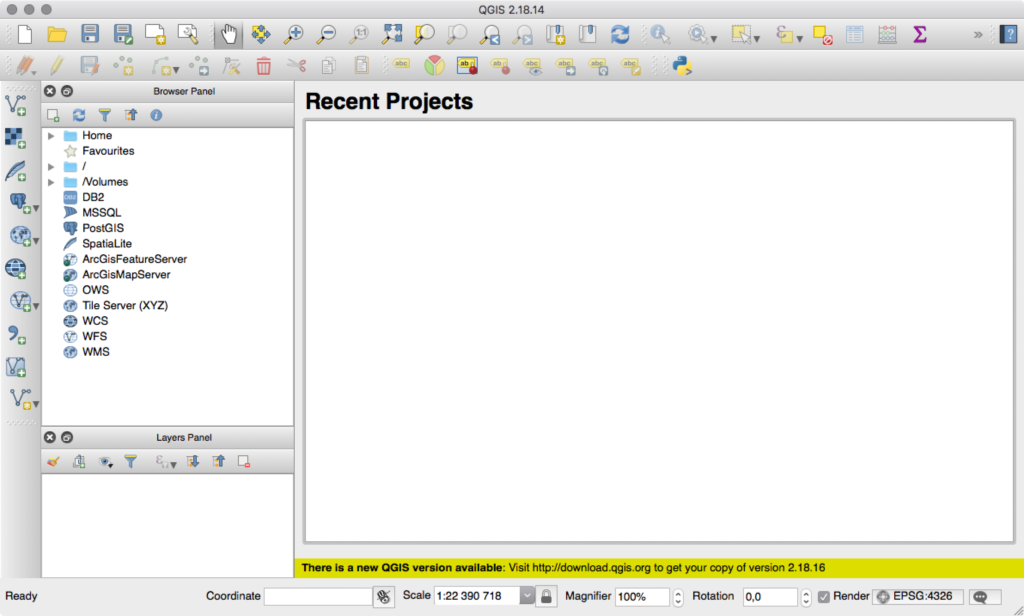
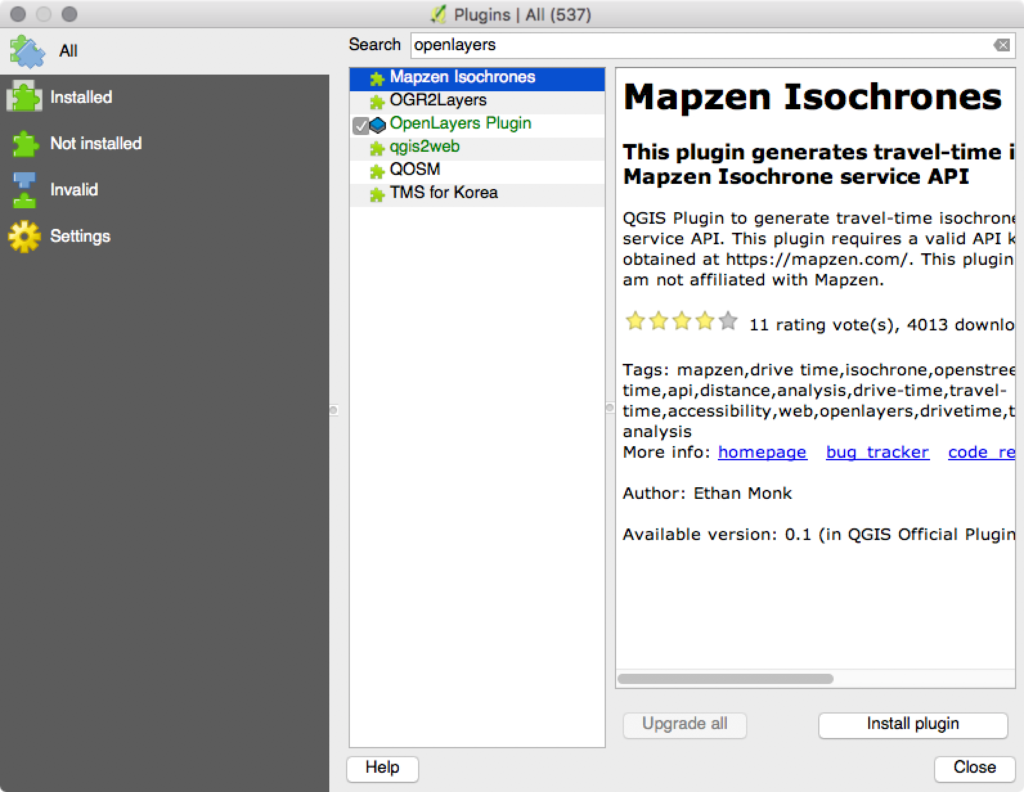
You will also need to install a few plugins. Go to Plugins → Manage and Install Plugins. Install the OpenLayers plugin and the Lat Lon Tools plugin.
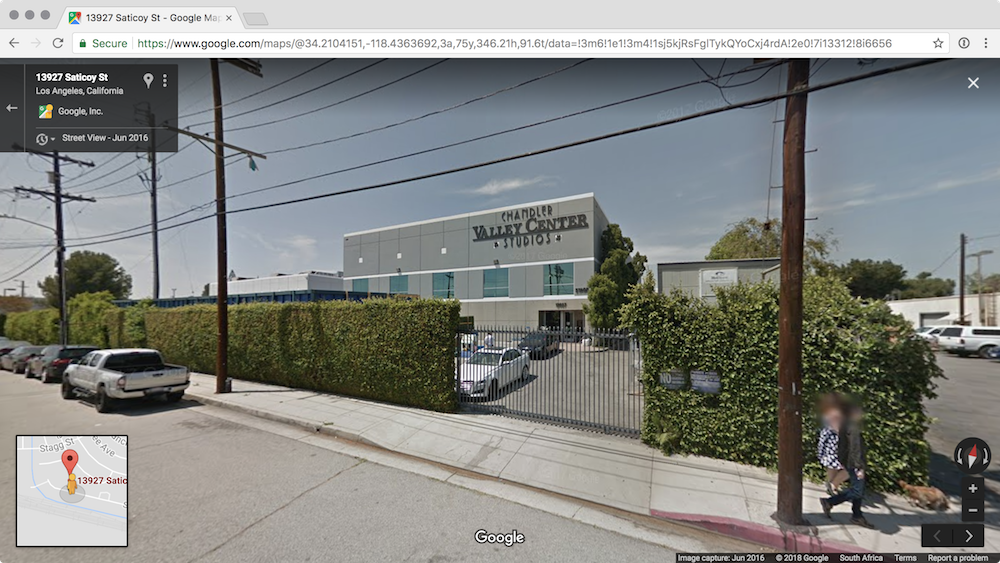
Next, we need to figure out where it is. In the show, it's said that the office is located at 1725 Slough Avenue in Scranton, PA. The actual location of the building is really at 13927 Saticoy Street in Panorama City, CA.
The easiest way to confirm a map location (if you remember how the place looks) is to search for the address in something like Google Maps, which provides a street view mode. Just to prove that the Panorama City location is the right one, I searched for that address in street view, and got this:
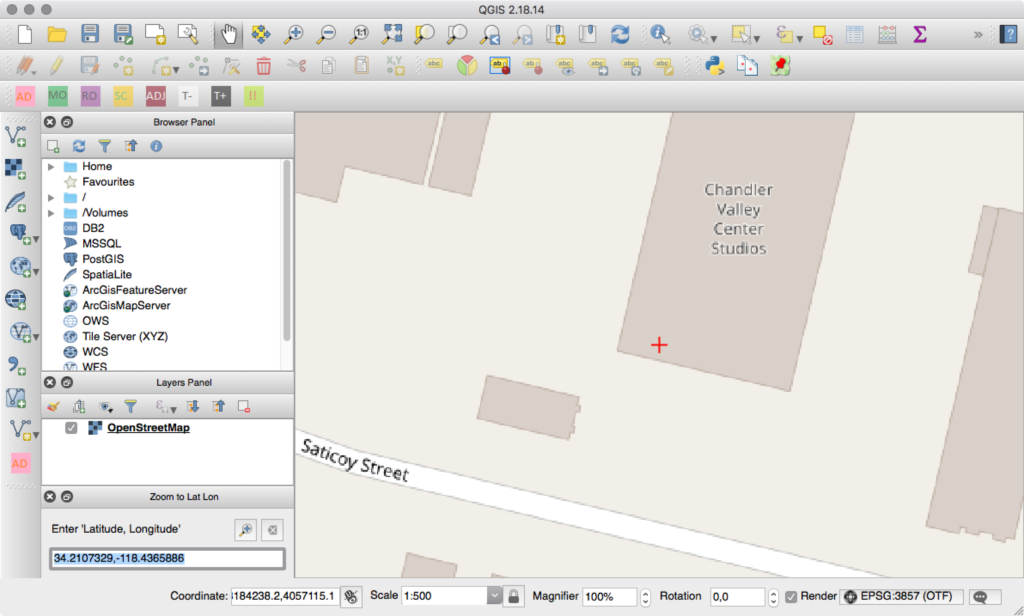
Now, it’s time to start creating the map. Add a new OpenStreetMap layer by going to Web → OpenLayers plugin → OpenStreetMap → OpenStreetMap. You should see a zoomed-out map of the world. Go to Plugins → Lat Lon Tools → Zoom To Latitude, Longitude and enter in the coordinates you want (in this case: 34.2107329,-118.4365886). You can change the scale to 1:500 for a closer look.
Next, click Raster → Georeferencer → Georeferencer. That’ll pop up a new, empty window. Click File → Open Raster to select the floor plan. “What floor plan?”, you ask. The very same you can download by searching for “The Office floor plan”.
I should mention that you’ll be asked what kind of Coordinate Reference System (CRS or SRS) you need. Select “WGS 84 / Pseudo Mercator”. I don’t really understand why, but it was the default and it seems to have worked well for me! The floor plan should then be displayed in the editor.
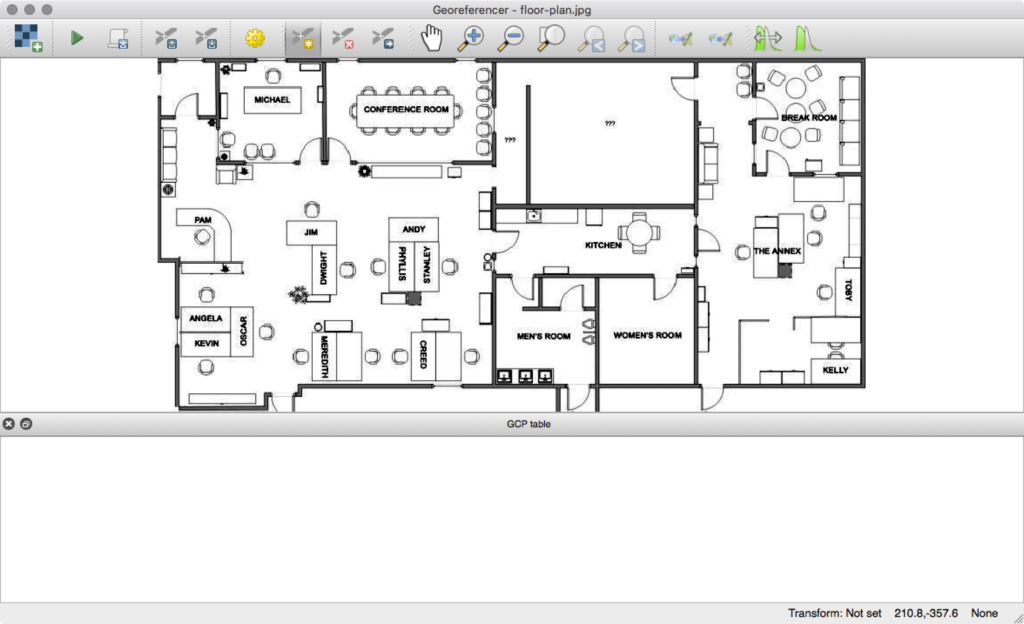
We need to link the indoor map to the outdoor map. Click Add Point (in the Georeferencer window) and click on a perimeter point (like the corner of the building). Then click From map canvas and select the corresponding point from the outdoor map.
Repeat this a few times. I know it’s probably technically not accurate to match the indoor map 1:1 with the outdoor building shape but that’s what I’ve done for now. Feel free to do the same. Try to be as accurate as possible.
When you’re happy with the points you’ve mapped, click Settings → Transformation Settings and make the settings look similar to this:
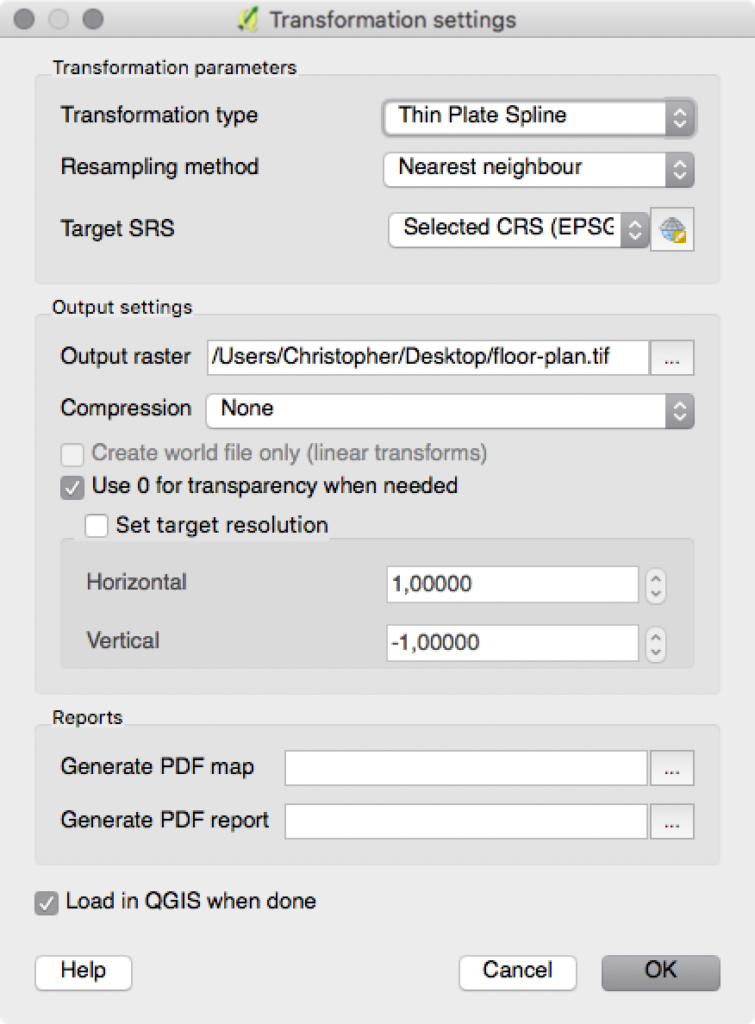
Most of that is default, but the Target SRS should be EPSG:3857. Click on. Then click the green play button (which is the Start Georeferencing button). This will take you back to the main QGIS window, except now the floor plan will overlay the outdoor map. You can right-click on the floor plan, in the layers panel, and click Properties. There, you can adjust the blend mode to something a little less jarring. I like the Lighten blend mode.
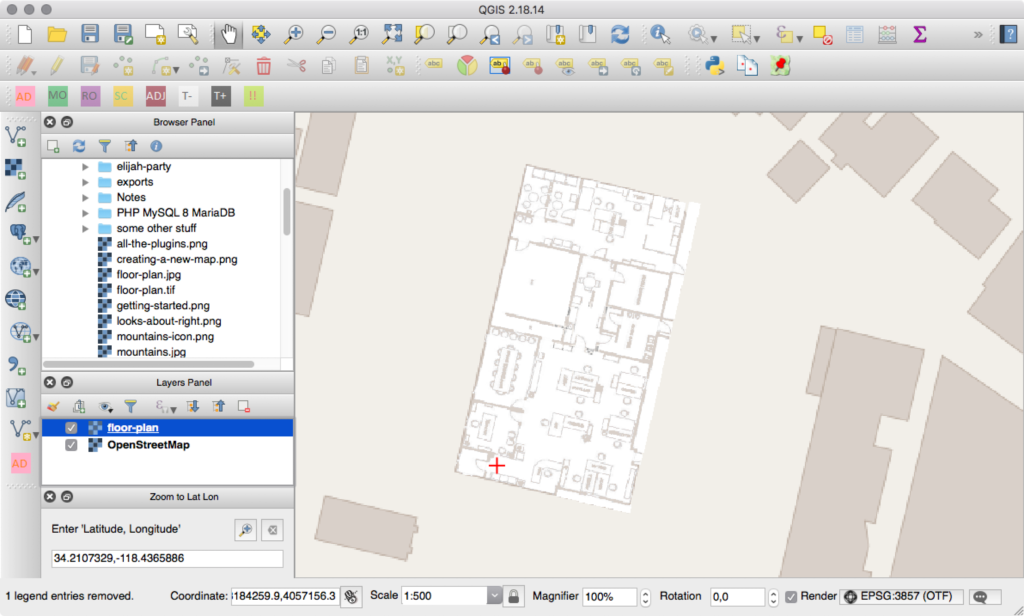
Now, we need to start drawing features on the floor plan. Click Layer → Create Layer → New Shapefile Layer. Set the Type to Polygon, pick the same SRS of EPSG:3857, and add type and name attributes to the attributes list. The defaults of “Text data” and “80” are fine. Click Ok and give the shape file a name.
When you see it in the layer panel, double-click it and set the transparency to 50% so that you can still see the map underneath. The shapes layer needs to be the top layer, so drag it if it’s not there already. Next, click the Toggle Editing button (the pencil) and then click the Add Features button (which looks like a green blog with a yellow icon over it).
Trace the boundary of the floor plan. When you’ve done that, right-click on the shape you’ve made and give it a type of building_outline. This is the boundary for how WRLD will render the indoor map. Click the Add Features button again, and begin to trace things like walls, windows, doors, and rooms. These shouldn’t overlap. When you’ve traced a segment, give it the corresponding type, like wall, window, door, or room. You can usually leave the “name” field empty, but if you specify a room name then WRLD will display it.
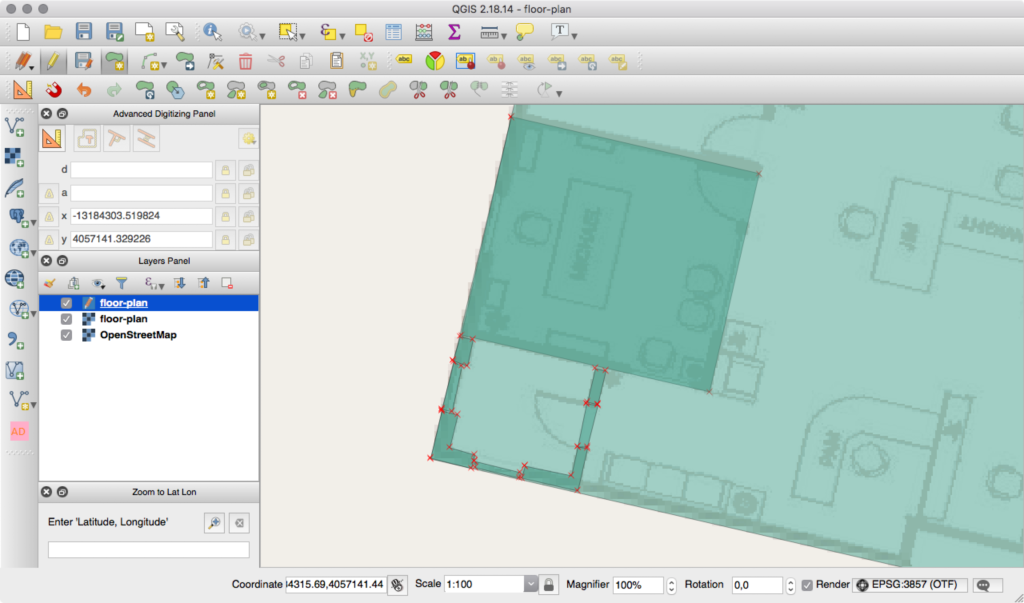
It’s a little less chaotic if you draw rooms instead of the walls, windows, and doors that make them up. There’s a full list of elements you can trace (and their types) here. Keep tracing features until you’ve got as much detail as you need.
Before we can import the map into WRLD, we need to make sure the feature IDs are unique. If you’ve been giving unique IDs then you’re all set. Otherwise, open the list of features by clicking Layer → Open Attribute Table and give each feature an ID. The order doesn’t matter.
Right-click on the shape layer and click Save As. Save the file somewhere, and open your text editor to the same folder you saved the shape layer file into. Create a new JSON file, called main.json:
{
    "id": "the-office",
    "name": "The Office",
    "owner": "Dunder Mifflin",
    "location": {
        "type": "Point",
        "coordinates": [-118.4365886, 34.2107329]
    },
    "levels": [
        {
            "id": "the-office-1",
            "name": "1",
            "readable_name": "First floor",
            "z_order": 0,
            "filename": "floor-plan.geojson"
        }
    ]
}
This is from main.js
The id field is just something for you to recognize the map by. You can put anything there. Name is the human-readable name of the map. Owner is the name of your company (or the company claiming the building on WRLD). Location is the point on the map where the indoor map lives. That array is [longitude, latitude].
Then, there’s an array of levels. You can have multiple floors per building. We’ve only designed one, so that’s the one we’ve defined in the array. Put these two files in a folder and create a ZIP file from the folder. Then, head over to https://mapdesigner.wrld3d.com/indoormap/latest and start to create a map!
Click New Indoor Map, and name it. Then, search for the appropriate building, using latitude and longitude. When you see the building you want, click on it and click Claim Buildings. Make sure you take the option to Download Floor Plan, as this'll make tracing it in QGIS easier in a moment. Next, skip to the Upload Map step and upload the ZIP file you created. It’ll take a few moments to process. Once successful, you should see a button on the map to click on. Clicking on it will take you inside the building…
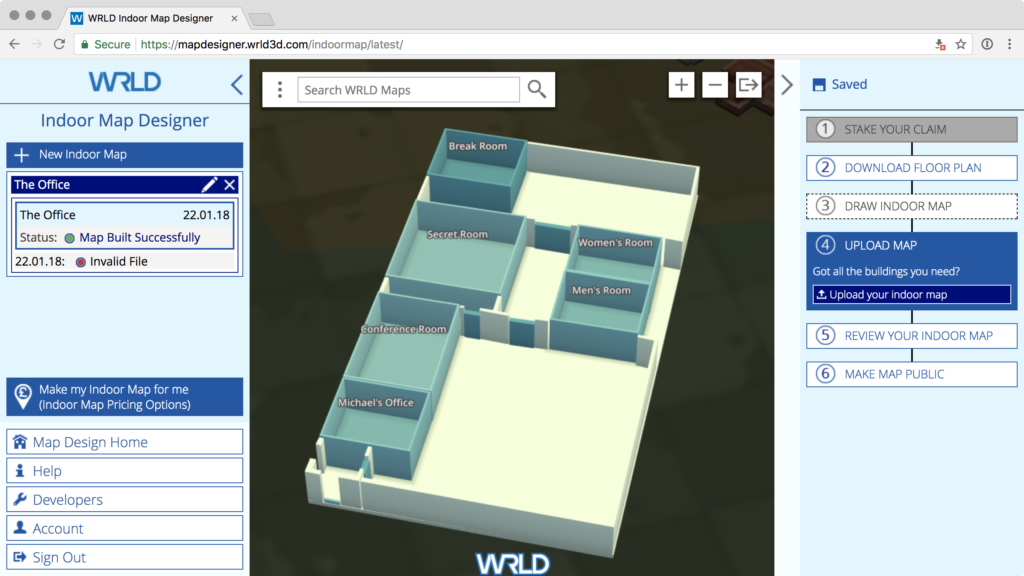
As you can see, I took a while to figure out that the location coordinates were “longitude, latitude” instead of “latitude, longitude”. When you’re happy with the indoor map, click Make map public.
There’s a longer, more detailed guide to creating these maps here. I found parts of it unhelpful, but your mileage may vary…
Interacting with Indoor Maps
It may take some time for your map to be approved. In the meantime, let’s look at how we can interact with indoor maps.
For this part of the tutorial, we’re going to work with code hosted on CodePen. The CodePens are demonstrative and best results will be achieved using the code extracts and steps in the article. If you’d like a local setup, look for details of how to set that up in the previous tutorial.
Let’s begin by creating a map and entering a pre-made building:
const map = L.Wrld.map("map", "f24b71dd92ab9e38cf4aa53806ab813d", {
    center: [56.459801, -2.977928],
    zoom: 15,
    indoorsEnabled: true,
})

map.indoors.on("indoormapenter", () => {
    map.indoors.setFloor(2)
    map.setView([56.459984, -2.978238], 20)
})

map.on("initialstreamingcomplete", () => {
    map.indoors.enter("westport_house")
})
This is from CodePen
In this example, we’re moving to the coordinates of the WRLD offices. Once the map has finished loading (via initialstreamingcomplete) then we ask the map to “go indoors”. On the indoormapenter event, we set the selected floor to 2 and zoom the map in further.
That’s going to work with the maps you’ve submitted, as well, once they’ve been approved.
We can interact with features by listening for a click event:
map.indoors.on("indoorentityclick", (event) => {
    map.indoors.clearEntityHighlights()
    map.indoors.setEntityHighlights(event.ids[0], [255, 0, 0, 128])
})
This is from CodePen
The indoorentityclick receives an event which holds the ID of the feature that we’re clicking on. We can use the clearEntityHighlights and setEntityHighlights events to toggle any custom colours on the features we want to highlight.
It’s probably time for another quote…
I saw Wedding Crashers accidentally. I bought a ticket for “Grizzly Man” and went into the wrong theater. After an hour, I figured I was in the wrong theater, but I kept waiting. Cuz that’s the thing about bear attacks… they come when you least expect it. – Dwight… again
Creating a Repeatable Highlight Pattern
Let’s try an experiment. Let’s make a “record” button that records clicks we make on the map; and then replays them all back to us. We’d need a record and play button, as well as an array of clicks…
<button id="record">record</button>
<button id="play">play</button>
This is from CodePen
Now, let’s connect to these buttons with click events:
Continue reading %How to Build an Indoor Office Map with WRLD%
by Christopher Pitt via SitePoint