[ This is a content summary only. Visit our website https://ift.tt/1b4YgHQ for full links, other content, and more! ]


by Mehwish Mehmood via Digital Information World
In this article, I'll show how to add another dimension to your web pages and applications with the new 3D transformation functions and properties in CSS. We'll look at transform, translate, rotations, scaling, perspective and more, along with issues to do with z-index, browser gotchas, and the best use cases for these functions.
HTML elements can be transformed in three dimensions:
On a two-dimensional screen, it's useful to think of the surface being at z co-ordinate zero. A positive z-value moves an object toward you (in front of the screen) while a negative z-value moves an object away (behind the screen). When perspective is added, a more distant z-value can cause the object to disappear entirely.
There are some things to note here:
3D transformations are well-supported in all modern browsers (IE10+), but:
transform-style: preserve-3d, which makes it impossible to create a 3D scene.-webkit-backface-visibility to hide rear faces. All other browsers support backface-visibility.The following sections describe the 3D transformation properties and functions. The demonstration page illustrates how most are used.
transform PropertyAny element can have a single transform property applied. It can be assigned a function with one or more parameters. For example:
.element {
  transform: function1(parameter1, [...parameterN]);
}
If two or more transformations are required, any number of space-separated functions can be defined:
.element {
  transform: function1(p1, [...pN]) function2(p1, [...pN]);
}
For example, to scale in the horizontal plane and transform vertically:
.element {
  transform: scaleX(2) translateY(50px);
}
Finally, transform: none; removes all existing transforms.
You have possibly used translate functions to move an element horizontally along the x axis or vertically along the y axis:
transform: translateX(50px);        /* 50px to right */
transform: translateY(-100%);       /* 100% up */
transform: translate(50px, -100%);  /* both together */
Any length unit can be used. Percentages reference the size of the transformed element so a 100px high block with translateY(80%) applied moves it down by 80 pixels.
Moving into the third dimension, we can also use translateZ:
transform: translateZ(-200px); /* 200px 'into' the screen */
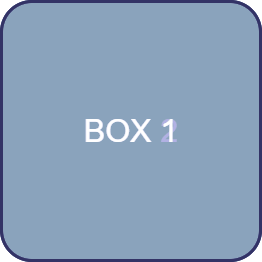
Given three elements, #box1, #box2 and #box3, absolutely positioned in the same place, with translateZ(-200px) applied to #box2 and translateZ(-400px) applied to #box3. The result is fairly uninspiring:
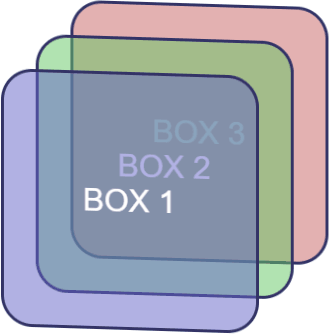
However, if we rotate the whole outer #scene container, the z-axis transformations become more evident:
#scene {
  transform-style: preserve-3d;
  transform: rotateX(-10deg) rotateY(-10deg);
}
The shorthand translate3d function allows an element to be moved along all three axes accordingly:
transform: translate3d(50px, 100%, 7em); /* x, y, z axis */
transform-style PropertyBy default (and always in IE), transform-style is set to flat. This indicates that all transformed children of an element lie in the plane of the element itself. In other words, inner elements could have any transform applied but they would be squashed into the flat plane of the container:
In most situations, transform-style: preserve-3d; must be used to indicate the child elements are positioned in 3D space and any transformation of the container will transform all accordingly.
The post 3D Transformation Functions in CSS appeared first on SitePoint.

Teaser Launching Soon page for Visual System, an upcoming design workflow tool for Sketch.
It’s practically impossible to imagine any dashboard without graphs and charts. They present complex statistics quickly and effectively. Additionally, a good graph also enhances the overall design of your website.
In this article, I’ll show you some of the best JavaScript libraries for graphs / charts. These libraries will help you create beautiful and customisable charts for your future projects.
While most of the libraries are free and open source, some of them provide a paid version with additional features.
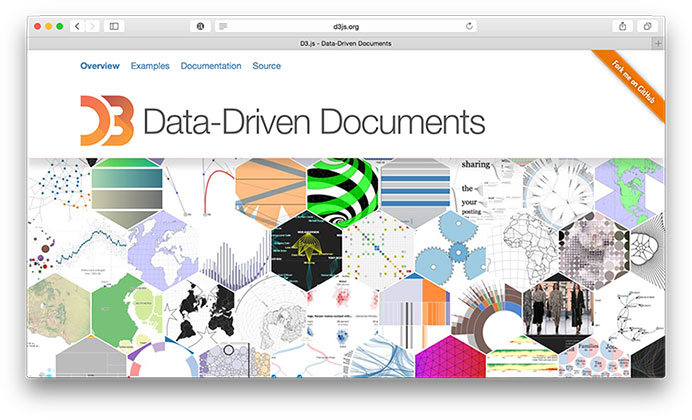
When we think of charting today, D3.js is the first name that comes up. Being an open source project, D3.js definitely brings many powerful features that were missing in most of the existing libraries. Features like "Enter and Exit", powerful transitions and syntax familiarity with jQuery or Prototype make it one the best JavaScript libraries for charting. Charts in D3.js are rendered via HTML, SVG and CSS.
Unlike many other JavaScript libraries, D3.js doesn't ship with any pre-built charts out of the box. However, you can look at the list of graphs built with D3.js to get an overview.
D3.js doesn't work well with older browsers like IE8. You can always use plugins like aight plugin for cross browser compatibility.
Websites like NYTimes, Uber and Weather.com have used D3.js extensively in the past.
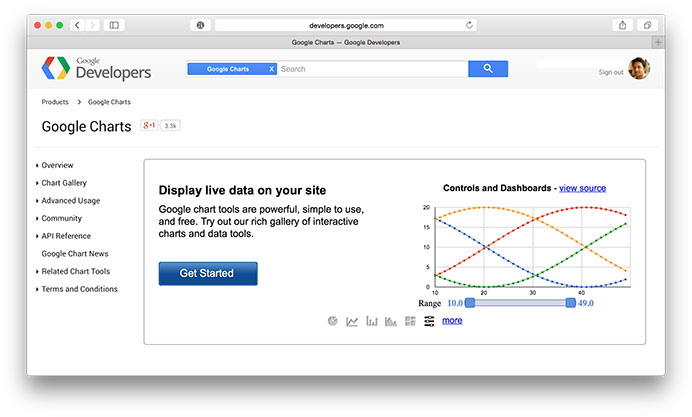
Google Charts is my go-to JavaScript library for creating charts easily. It provides many pre-built charts like area charts, bar charts, calendar charts, pie Charts, geo charts, and more.
Google charts also comes with various customization options that help in changing the look of the graph. Charts are rendered using HTML5/SVG to provide cross-browser compatibility and cross platform portability to iPhones, iPads, and Android. It also includes VML for supporting older IE versions.
Here's a great list of examples built using Google charts.
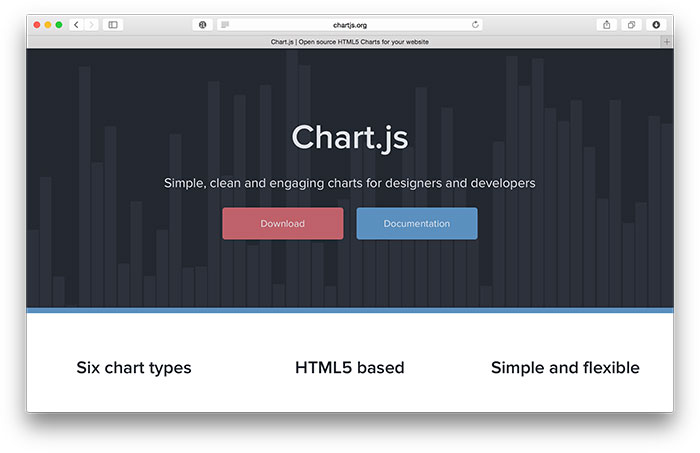
ChartJS provides beautiful flat designs for charts. It uses HTML5 canvas element for rendering. Support for older browsers like IE7/8 is added through polyfill.
ChartJS charts are responsive by default. They work well in mobiles and tablets. With 6 different types of core charts out of the box (core, bar, doughnut, radar, line, and polar area), ChartJS is definitely one of the most impressive open source charting libraries in recent times.
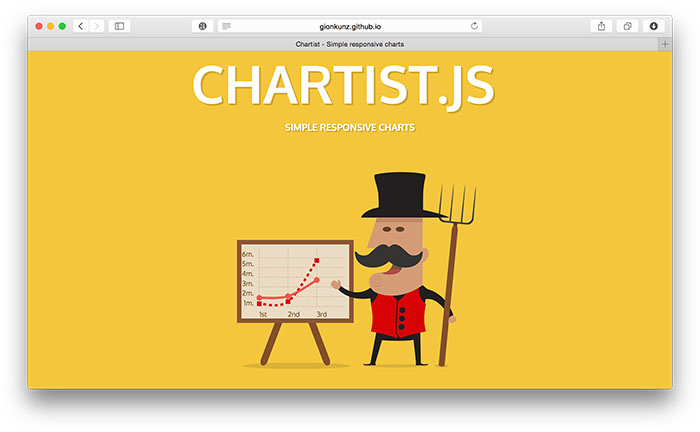
Chartist.js provides beautiful responsive charts. Just like ChartJS, Chartist.js is also the product of the community that was frustrated by using highly priced JavaScript charting libraries. It uses SVG to render the charts. It can be controlled and customised through CSS3 media queries and Sass. Also, note that Chartist.js provides cool animations that will work only in modern browsers.
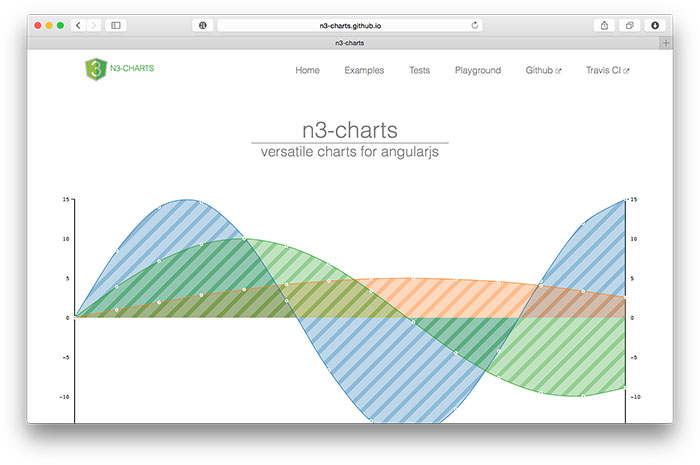
If you are an Angular developer, you will definitely find n3-charts extremely useful and interesting. n3-charts is built on top of D3.js and Angular. It provides various standard charts in the form of customisable Angular directives.
Checkout list of charts built using ns-charts.
Ember Charts is another great open source repository built with D3.js and Ember.js. It provides time series, bar, pie, and scatter charts that are easily customisable. It uses SVG to render charts.
The post 24 JavaScript Libraries for Creating Beautiful Charts appeared first on SitePoint.


Centrally-divided One Pager for Sketchframes – a hand-sketch-style, Bootstrap-based UI Kit for Sketch App.