In the context of user interface design, red typically means "no" or "error" in Western cultures. But why can't it mean something positive instead? Well, actually, in Asian cultures, red symbolizes longevity, celebration, happiness and prosperity. Brides wear red dresses at their wedding, and receive monetary gifts in red envelopes. That's a far cry from "no" or "error".
Color matters. Color has meaning. Color helps users make decisions faster, because color indicates what the result of an interaction will be.
Consider a green button with the word "No". Now, in Western cultures, this is very confusing, because the green is indicating "yes" while really saying "no". If we were to rush into this (as users often do), we might even click the green button while completely misunderstanding what it means to do so.
In Asian cultures, red doesn't typically indicate "no", so using red in UI design might result in the user making unintentional mistakes. But of course, there are exceptions. Pinterest uses red in their branding for example, but we can quickly decipher this since red is used all over their website (logo, icons, buttons, etc.). Context matters. Also, what means something in a certain culture might not always ring true for UI design specifically.
We'll chat a little more about the diagnostic side of things later. For now, let's learn how to find out where our users are from, using Google Analytics.
Location Demographics
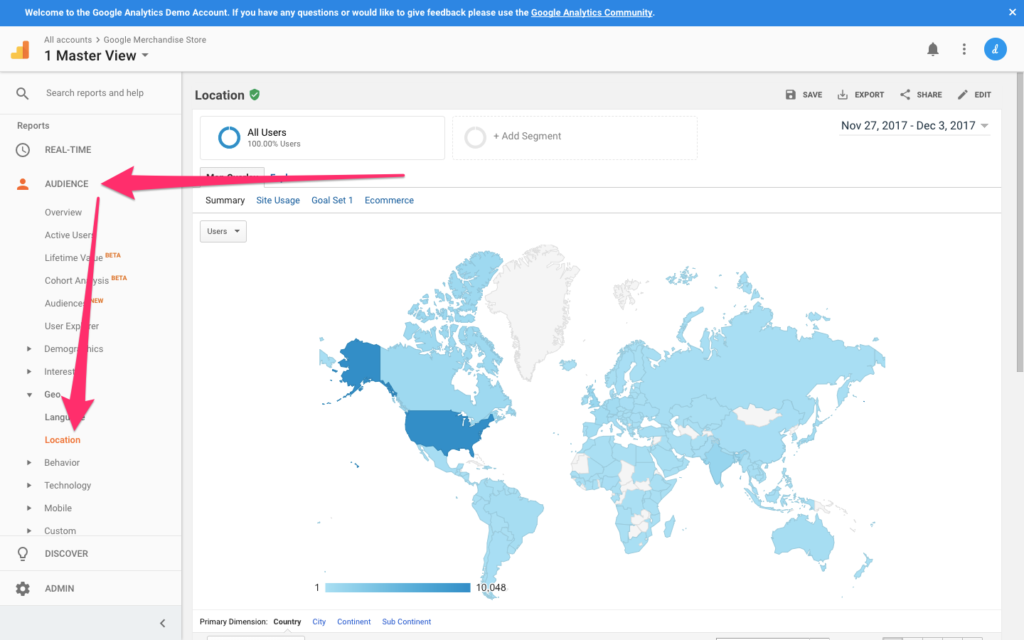
In the Google Analytics sidebar where the five types of reports are listed (Real-Time, Audience, Acquisition, Behavior, Conversions), choose Audience → Geo → Location. As with most reports, an overview is the first thing you'll see. For Geo → Location reports, this overview is a map.
Getting realistic data
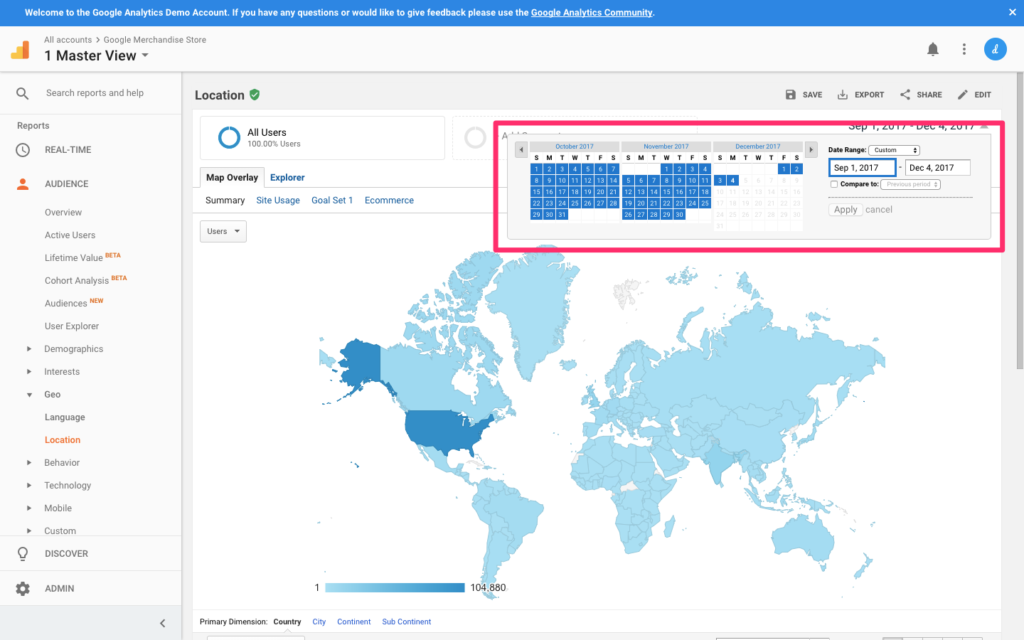
Before reading the data, you'll want to define an appropriate date range. Consider that 30-day timespan towards the end of the year that incorporates not one, but two Western holidays (Thanksgiving and Christmas). Website traffic is notoriously low over the holidays, and we'll want to analyze data that we know to be realistic. Analyzing data is always easier when the website in question receives a lot of traffic as well.
From the date range chooser in the top-right corner, choose a range you deem to be appropriate (I would choose a recent 3-month range).
Your first look at user location demographics
Even though the meaning of color varies slightly from region to region, the core symbolism doesn't change that much. For this reason, analyzing data by Country might seem a little over the top. By Continent might be better.
Scroll down to the table breakdown and select "Continent" as the Primary Dimension. This should make your observations easier to make.
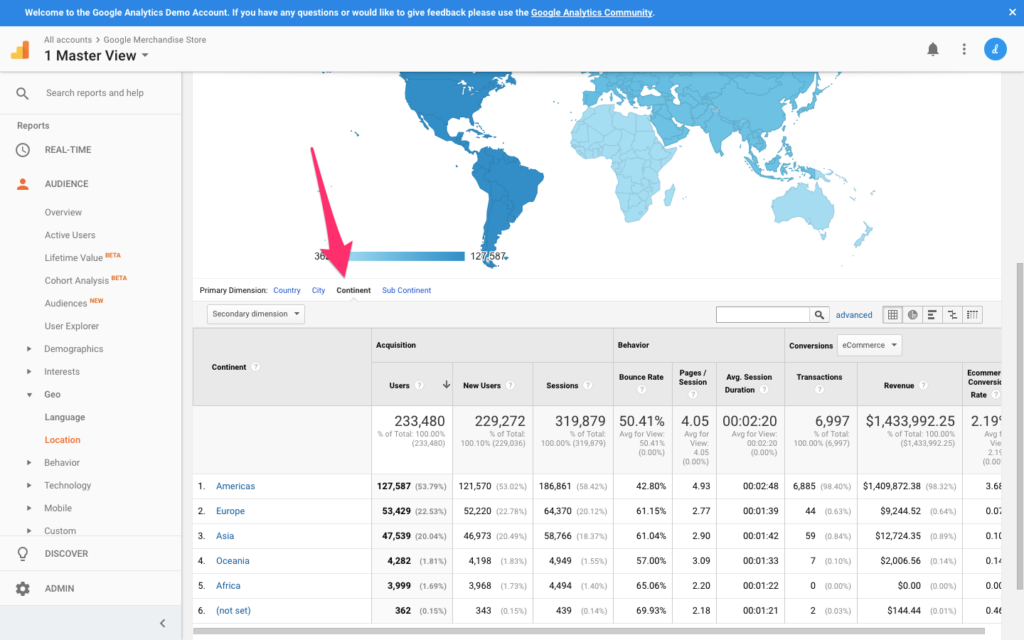
While Americas represents 54% of all users, Europe comes in 2nd with 23%. We'll start by figuring out if one demographic is clearly having more trouble than the other. Oceania and Africa are the minority at less than 2% each, so they shouldn't be the primary concern at first. Asia totals at 20%, with metrics similar to those of Europe. Americans are the most common demographic.
Let's focus on our two largest demographics.
Which Demographic Is Having Trouble?
You can identify which dimensions are having the most trouble by comparing certain metrics (such as Bounce Rate, Pages/Session, Avg. Session Duration, and most importantly, Goal Conversion Rate) with other dimensions, and once you've done that, you can then begin to locate the precise moment where those users are exiting your website.
Let's assume that Europe is your lowest-converting demographic. We'll need to segment this dimension, filtering for European users.
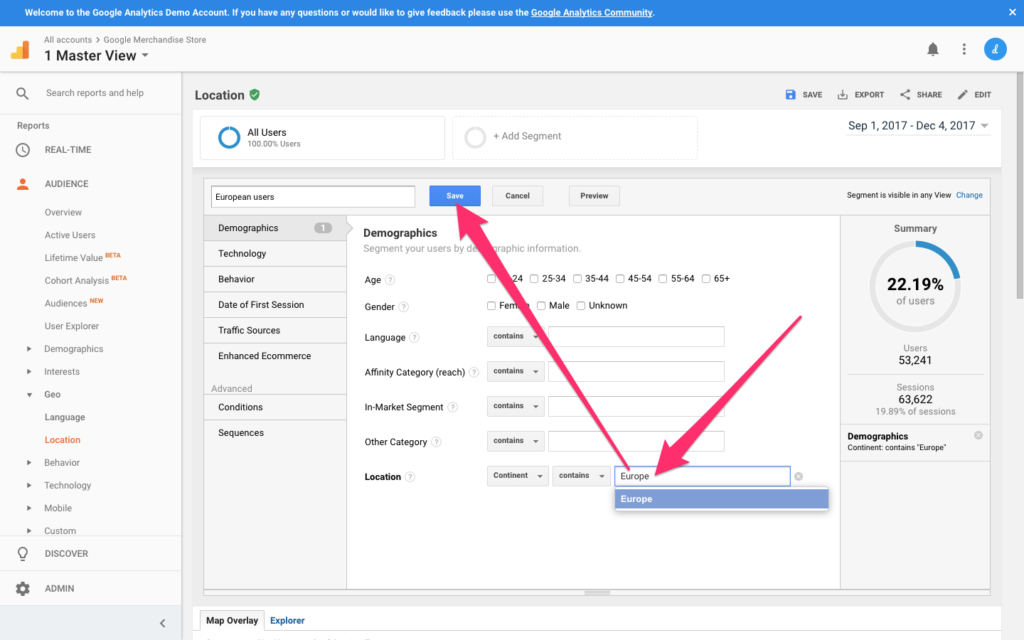
Scroll up and click the "+ Add Segment" button, then "+ New Segment".
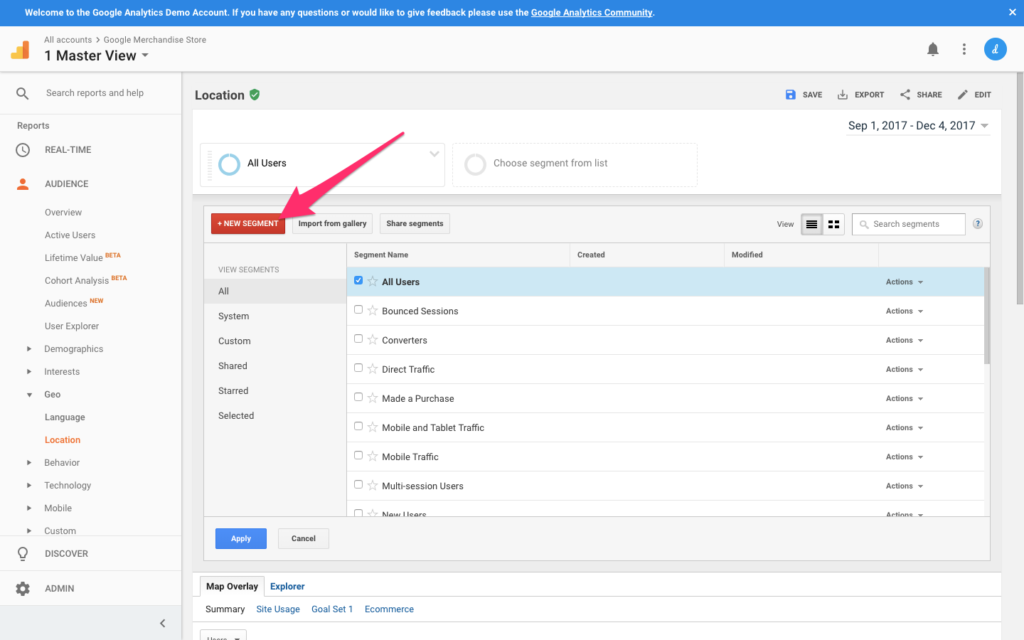
Give your segment a name — for example "European users" — and type "Europe" into the input field described as "Location" (it should autocomplete as "Europe"). Click "Save" to keep the changes.
Continue reading %Designing for Different Cultures with Location Demographics%
by Daniel Schwarz via SitePoint
No comments:
Post a Comment