Google Optimize is Google’s A/B testing tool for websites. As with most Google apps, Google Optimize offers a lot of functionality for free, with a corporate tier for when your A/B testing needs become more complex. In this article, I’ll show you how to use Google Optimize to make data-driven design decisions by experimenting with variations, to see which converts better.
Google has done well to make Google Optimize accessible to all website owners by removing the need for a web developer, and making the tool really easy to use. Better yet, Google Optimize integrates directly with any Events and Goals defined in Google Analytics, to make evaluating metrics even easier. If you already have your Goals and Events set up correctly, A/B testing with Google Optimize is as simple creating variations of web pages using the Google Optimize interface, selecting the relevant Goals to evaluate, going live with a website experiment, and then waiting to analyze the results.
Here’s what a typical workflow looks like:
-
You use Google Optimize to test solutions alongside each other.
I’ll be showing you how to test solutions with Google Optimize in this article.
Getting Started
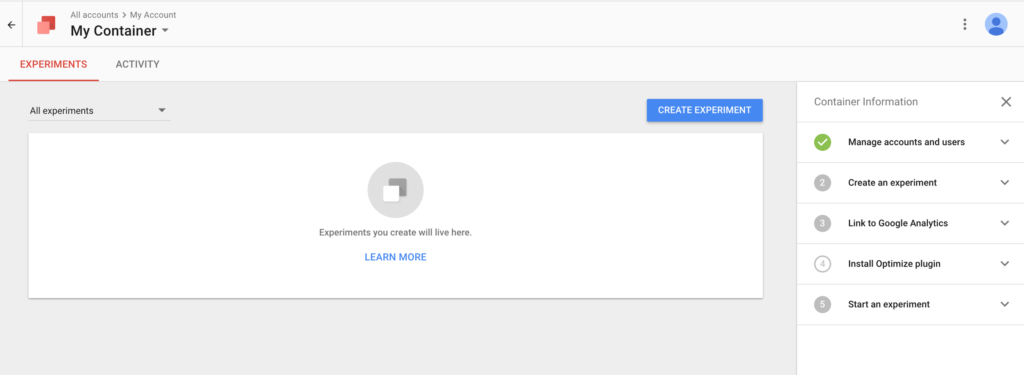
After registering and logging in, you’ll be met with the screen above, which helps you to get set up quickly and efficiently, in a step-by-step manner as indicated on the right-hand side. In short, all you need to go live with a design experiment is to link your account to the relevant Google Analytics account, create the experiment, and then, just as with Google Analytics, insert a code snippet into your website. After that, you’re ready to begin A/B testing.
Google Optimize will walk you through the entire thing.
A/B Testing with Google Optimize
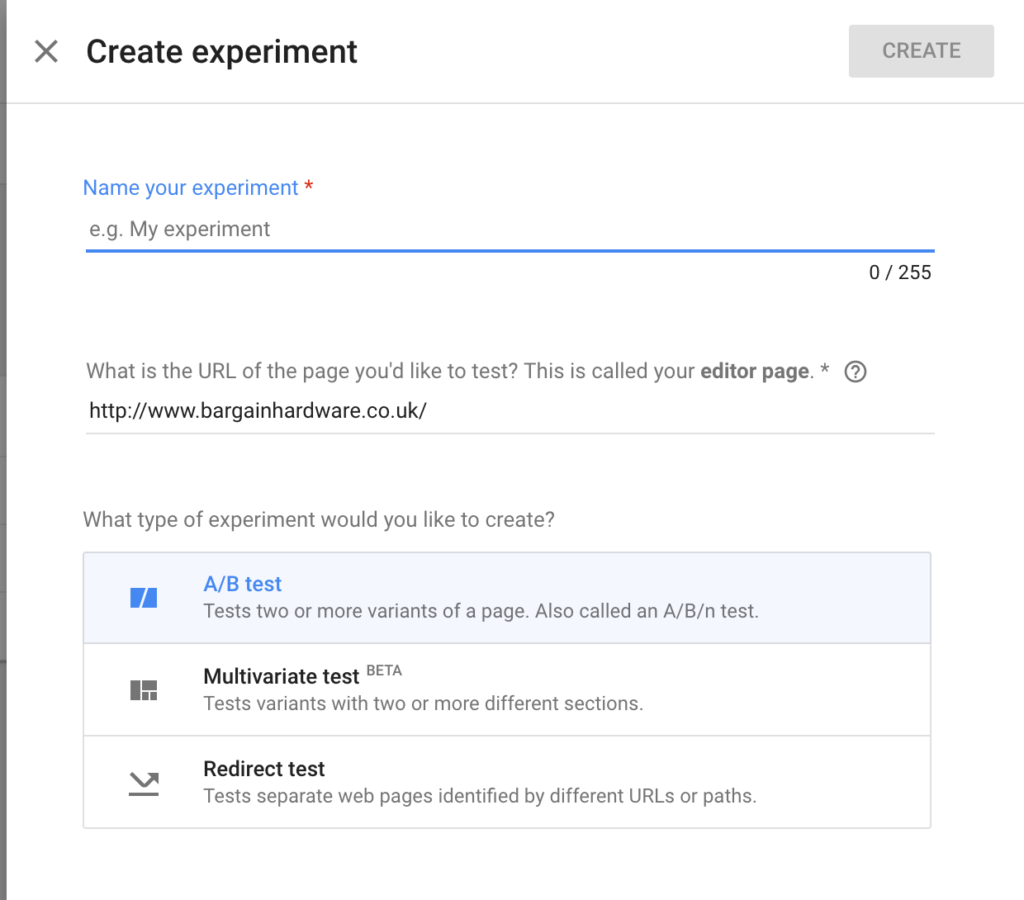
Creating your first A/B test with Google Optimize is really easy. Click the Create Experiment button in the top-right corner, then choose the A/B Test option on the right-hand side, where you’ll then be met with a screen that asks you to create the variation for your A/B test and define the Google Analytics “Goals” that will be the criteria for evaluation. (That is, a “Goal” can be users purchasing an item, where, if variation B results in more conversions, that’s the winning variation that we’ll implement permanently.)
When creating variations, the Google Optimize visual editor will help you to reorder elements, change copy, and/or rewrite aspects of your HTML/CSS code. It’s up to you how complex you want your variations to be.
Once you’ve created your variation, you’ll need to select the relevant Google Analytics Goals from within the "Objectives" tab (to become the objective of your experiment), and add a description or hypothesis to explain the expected results, so that in future you can refer back to your historical experiments and quickly understand the reasoning behind doing them.
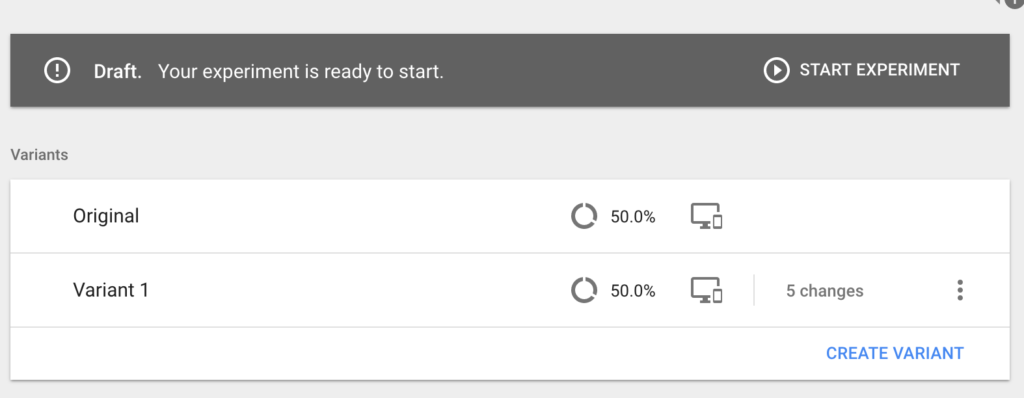
At this stage, your A/B test is almost ready and should look like this:
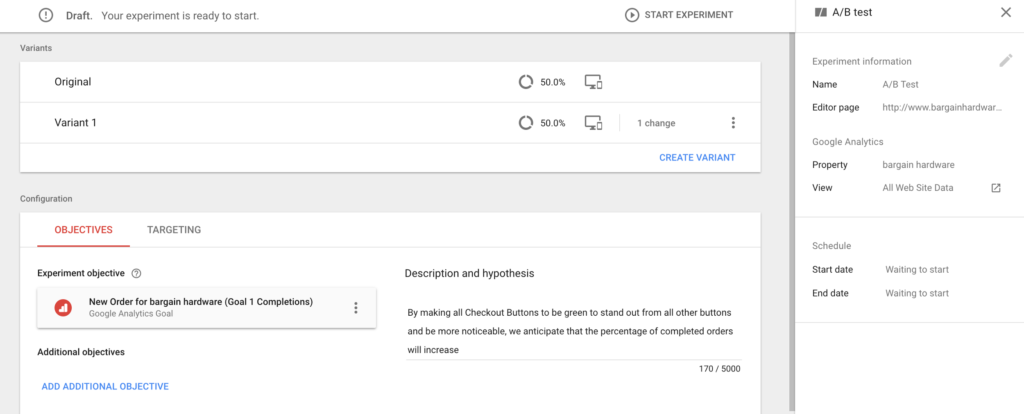
Now, technically, we could go live with this experiment by clicking the Start Experiment button, but I would recommend that you customize your targeting first, to ensure that your experiment is reaching the desired audience. You can define the percentage of visitors who are subjected to this experiment, and choose which segment of visitors to target. (For example, you could target only returning users, or those from a specific country. This will depend on the problem users are facing on your website — where, for example, maybe only a certain demographic of users are experiencing said problem.)
Customizing the targeting can be extremely useful when testing a highly experimental change that may have a negative effect on your website. Rather than risk losing traffic and/or revenue, you could show the variation to only 25% of your visitors, and the remaining 75% will see the usual variation. To do this, select the total percentage of visitors you wish to be included in your experiment in the Who slider on the left, and then split what percentage of those users go to which variation by clicking the Edit button on the right.
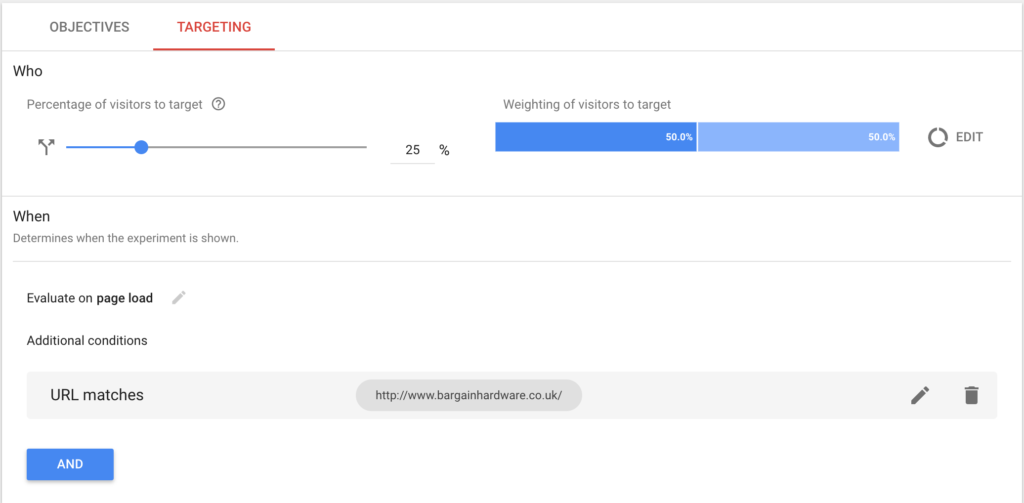
In the targeting section, you’ll also have the opportunity to show the experiment only when a specific event occurs. (For example, if the user chooses "Germany" as their location, then show a variation of the checkout aimed at German users.) To do this, you’ll need to add a custom JavaScript event in the Data Layer (conforming to the Google Tag Manager Data Layer specification, which you can read here). For more information on Data Layers and how to use them, read here. It’s a somewhat complex matter, but not necessarily one you need to know about in order to create a simple A/B test.
Congratulations, your A/B test is now ready go live. Just click the "Start Experiment" button in the top-right corner!
Pro tip: with Google Optimize, it’s possible to specify start and end dates for your experiments within the experiment options from the sidebar, so that you can prepare in advance for time-specific events — such as switching out your images and marketing copy over Black Friday and Halloween.
The post How to Perform A/B Testing with Google Optimize appeared first on SitePoint.
by Jamie Murphy via SitePoint
No comments:
Post a Comment