Thursday, June 7, 2018

Avocode 2017 UI Design Report

Slick Landing Page by Avocode promoting their 2017 UI Design Report. The long-scrolling site teases snippets of stats along with gorgeous animations enticing you to request the full report download (while joining their newsletter). Neat touch with the design platforms preloader and how you can share each highlighted statistic via the social icons in each section.


by Rob Hope @robhope via One Page Love

Wednesday, June 6, 2018

Replacing jQuery with Vue

I’m willing to bet that there are a lot of developers out there who still reach for jQuery when tasked with building simple apps. There are often times when we need to add some interactivity to a page, but reaching for a JavaScript framework seems like overkill — with all the extra kilobytes, the boilerplate, the build tools and module bundlers. Including jQuery from a CDN seems like a no-brainer.

In this article, I’d like to take a shot at convincing you that using Vue.js (referred to as Vue from here on), even for relatively basic projects, doesn’t have to be a headache, and will help you write better code faster. We’ll take a simple example, code it up in jQuery, and then recreate it in Vue step by step.

What We’re Building

For this article, we’re going to be building a basic online invoice, using this open-source template from Sparksuite. Hopefully, this should make a refreshing change from yet another to-do list, and provide enough complexity to demonstrate the advantages of using something like Vue while still being easy to follow.

Screenshot of template

We’re going to make this interactive by providing item, unit price, and quantity inputs, and having the Price column automatically recalculated when one of the values changes. We’ll also add a button, to insert new empty rows into the invoice, and a Total field that will automatically update as we edit the data.

I’ve modified the template so that the HTML for a single (empty) row now looks like this:

<tr class="item">
  <td><input value="" /></td>
  <td>$<input type="number" value="0" /></td>
  <td><input type="number" value="1" /></td>
  <td>$0.00</td>
</tr>

jQuery

So, first of all, let’s take a look at how we might do this with jQuery.

$('table').on('mouseup keyup', 'input[type=number]', calculateTotals);

We’re attaching a listener to the table itself, which will execute the calculateTotals function when either the Unit Cost or Quantity values are changed:

function calculateTotals()  {
  const subtotals = $('.item').map((idx, val)  => calculateSubtotal(val)).get();
  const total = subtotals.reduce((a, v)  => a + Number(v),  0);
  $('.total td:eq(1)').text(formatAsCurrency(total));
}

This function looks for all item rows in the table and loops over them, passing each row to a calculateSubtotal function, and then summing the results. This total is then inserted into the relevant spot on the invoice.

function calculateSubtotal(row) {
  const $row = $(row);
  const inputs = $row.find('input');
  const subtotal = inputs[1].value * inputs[2].value;

  $row.find('td:last').text(formatAsCurrency(subtotal));

  return subtotal;
}

In the code above, we’re grabbing a reference to all the <input>s in the row and multiplying the 2nd and 3rd together to get the subtotal. This value is then inserted into the last cell in the row.

function formatAsCurrency(amount) {
  return `$${Number(amount).toFixed(2)}`;
}

We’ve also got a little helper function that we use to make sure both the subtotals and the total are formatted to two decimal places and prefixed with a currency symbol.

$('.btn-add-row').on('click', () => {
  const $lastRow = $('.item:last');
  const $newRow = $lastRow.clone();

  $newRow.find('input').val('');
  $newRow.find('td:last').text('$0.00');
  $newRow.insertAfter($lastRow);

  $newRow.find('input:first').focus();
});

Lastly, we have a click handler for our Add row button. What we’re doing here is selecting the last item row and creating a duplicate. The inputs of the cloned row are set to default values, and it’s inserted as the new last row. We can also be nice to our users and set the focus to the first input, ready for them to start typing.

Here’s the completed jQuery demo:

See the Pen jQuery Invoice by SitePoint (@SitePoint) on CodePen.

The post Replacing jQuery with Vue appeared first on SitePoint.


by Nilson Jacques via SitePoint

Optimizing Bounce Rates with FullStory’s Session Replay Tool

“Insights” are the de facto word of choice when it comes to analytics — and for good reason. Teams need to know critical information about their product, users, website performance (and more) to make decisions.

When it comes to web analytics, the typical insights are metrics that are built around clicks and taps, page visits, session durations, bounce rates, conversion rates, and other aggregated data points. These metrics are useful for diagnosing problems (or spotting opportunities) relating to UX or otherwise, but once identified, this is often where teams get stuck.

The solution to this data quandary is to have a way to "zoom in" on an identified issue to see what’s going on, learn more, and then come up with viable solutions. This hybrid, quantitative-qualitative strategy takes advantage of both diagnostic and descriptive analytics tools. But just how does it work, in practice? And what kinds of insights can be discovered?

In this article, we’ll be focusing on bounce rates, looking specifically at how a bounce rate can be used as a way to identify opportunities for search engine optimization, app copy optimization, landing page optimization (including identifying fake paid traffic), and overall UX optimization.

Bounce rates mean something — but what?

If you’re wondering how the qual-quant strategy works in real life, consider one of the most commonly used metrics in web analytics: the bounce rate.

As a refresher, a bounce is defined as "a session that triggers only a single request to the analytics server, such as when a user opens a single page on your site and then exits without triggering any other requests to the analytics server during that session". (Source: Google Analytics.)

Bounce rates are bad, right? Well, as Google Analytics explains on its help page, "it depends." The thing about bounce rates is that, while they might point to something going wrong, or signal the relative performance of different traffic sources, or sub-optimal UX, they tell you next to nothing about what is actually working (or not working) on the page.

Using bounce rates as a signal of high- or low-performing web pages and then analyzing those pages using a session replay tool like FullStory can help provide the needed answers to optimize the page.

Here’s how it works.

Optimizing UX with Bounce Rates and FullStory

First, identify underperforming pages using Google Analytics (or your preferred analytics platform). Then, search for session recordings on those pages in FullStory using the URL in question as your segmenting parameter. You can then refine your results further, based on other criteria (such as sessions referred from a specific URL, or visits with a duration of 60 seconds or less).

You can also cut your search by sessions that contain signals of user frustration. At FullStory, we call these "Rage Clicks"."

Rage clicks

You can search in FullStory for all sessions that contain Rage Clicks.

Once you have a list of sessions to watch, set aside an hour to make observations. Take notes in a spreadsheet of any surprising behaviors:

  • What’s being clicked — or not clicked?
  • Where does user attention seem to drop?
  • Is anything on the page breaking?
  • Are key elements being obscured?

As you make observations, take notes in a spreadsheet. After an hour — or once you hit a point of diminishing returns — review your notes and see if any trends appear. After a while, this qualitative analysis will lead to a couple immediate improvements and a handful of ideas about how to optimize the user experience. Execute the immediate improvements and use your ideas (and a handy A/B testing tool) to experiment.

Sounds simple, right? But does this work in all cases?

The post Optimizing Bounce Rates with FullStory’s Session Replay Tool appeared first on SitePoint.


by Justin Owings via SitePoint

How to Deploy a WordPress Site on Alibaba Cloud SAS

When it comes to cloud hosting, Alibaba Cloud is a relatively new kid in town. We have gotten used to AWS and its plethora of options, Heroku, and Google's cloud solutions, which all either come with a level of complexity, or a price that is relatively high for anything except demo applications, or both.

Complexity in this area has lead to courses being taught and books being written about some of these solutions, like Amazon's cloud.

Developers know that all the time devoted to debugging, learning, and perfecting deployment is time not spent on developing the core solutions we are working to deploy.

When it comes to raw VPS solutions, DigitalOcean, Vultr, and Linode have been go-to vendors for some years now. Here, as well, there are tradeoffs: when one wants to deploy a high-level solution, like well-known Content Management Systems (such as Drupal or WordPress), or eCommerce solutions (such as Magento, WooCommerce, or OpenCart), they can choose a dedicated, specialized, high-profile managed hosting. These have pretty steep prices, and not much in terms of 100% dedicated resources. Alternatively one can go for a dedicated system. For one to have a guaranteed 4GB of RAM available for their web application, or guaranteed processor cores, an available system shell, or one wants to be able to switch server stack components versions, one has to go for a dedicated server or a VPS.

Shared hosting environments only go so far in terms of squeezing the last bits of performance out of your server, or choosing and optimizing components of the server stack. They don't give you ultimate control of the hosting environment, and often deliver mediocre results.

The dedicated systems that we mentioned are often the best solution for high-performing systems, and projects that care about a tuned and polished web visitor experience. They tend to be relatively affordable, they guarantee server resources, if not the entire machine in data center, but... they put a demand on the developer, or sysadmin, to set things up. If these dedicated systems come with sysadmin time and care included, they are usually not very competitive on price.

Non-managed VPS and dedicated server solutions have the best edge here, in terms of hosting costs. This is where companies like Digital Ocean, Vultr and similar hosts have blossomed. But these vendors require knowledge of Linux administration, and knowledge of the intricacies of server stacks, like LAMP, LEMP, and others.

With dedicated solutions, one has to hire sysadmins and developers to set these things up. They need to install the latest version of PHP and all of its modules, then the database and the server (like Apache or Nginx), and then there is the setup of the virtual host, SSL, debugging and compatibility issues that arise, package issues, the list goes on...

This makes dedicated hosting a non-trivial endeavor. This is where companies like Cloudways have found their niche.

Alibaba Cloud

And now there is Alibaba Cloud.

Alibaba Cloud is an ambitious vendor which offers a comprehensive spectrum of services, from CDN, cloud-based database services, big data and analytics solutions, media streaming and IoT solutions, and shared web hosting or flexible VPS solutions.

They boast their own proprietary virtualization solutions developed in-house, without the virtualization overhead, and with good resource isolation. A major known solution without the virtualization overhead so far has been OVZ, but it hasn't provided such good resource isolation. This is why its competitor technologies, KVM and XEN, have fared somewhat better with the premium range of VPS providers.

If Alibaba has indeed developed a solution with little-to-no resource overhead, but with excellent isolation, this will give them an edge on the VPS providers market.

One of Alibaba products is SAS - Simple Application Server. Since SAS builds on ECS architecture, it takes advantage of the aforementioned virtualization solutions.

Simple Application Server use the ECS I/O-optimized shared instances with CPUs, memory, operating systems, network, disks, and other services necessary to build a server.

Each user can have up to five SAS instances running.

Its goal is to find the sweet spot in servicing exactly the customers we described above - those who need price-competitive hosting solutions which offer control of the environment and a guarantee of resources.

Simplicity of Deployment

What the SAS solution boasts is the ability for everyone to launch their web application within minutes - from Alibaba's web management platform, without the need to set everything up - or even to log into the system's shell.

This is not something that established VPS vendors can boast about, for the most part.

We have tried this, and it took us a mere couple of minutes from logging into our Alibaba account to actually seeing our website live and running.

The process is painless and straightforward.

When we register for Alibaba Cloud here, we are presented with its free credit offer - Alibaba gives $300 of credit to new users. We can use it for the purpose of this tutorial - deploying a WordPress website on Simple Application Server. After we confirm our payment method, such as a credit card or PayPal, we get our starting credit activated, and we are good to go!

Now we can log into our management console, and select Simple Application Server in the left sidebar, among the Base services. When we are there, we can click "Create Server" button in the upper right corner, and we will be presented with options for selecting the server location - EU, US and Asia locations are available.

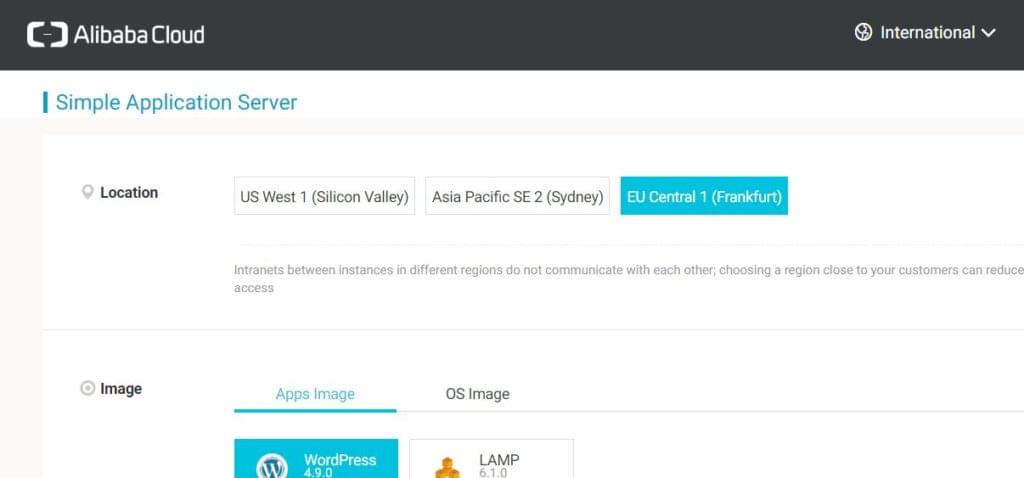
We can then select one of the prebuilt available images — apps or OS images are available (different Linux and Windows versions). For this guide, we selected the WordPress app image.

We then select the instance plan. These plans have different hardware resources available and payment plans, including monthly, quarterly, six monthly payment plan, annually and so on.

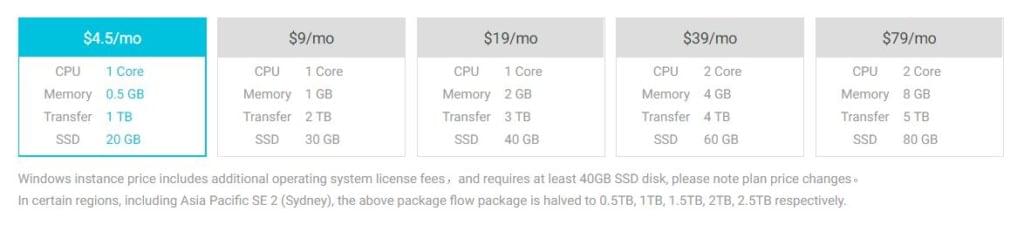
Plans available range from 0.5 to 8 GB of RAM, 1 or 2 CPU cores, and all come with SSD storage, from 20 to 80GB. Those in need of more flexibility have other solutions available that are somewhat lower-level, but offer more control, like ECS.

After we pay, we can go to the management console for our SAS instance, which will take a couple of minutes to be deployed.

After our instance is deployed, it has an entire LAMP stack installed, along with WordPress. We then go to the web management panel, which is among the best — perhaps in its level of details and options it even has an edge over the competitors, like Vultr, Digital Ocean, and others.

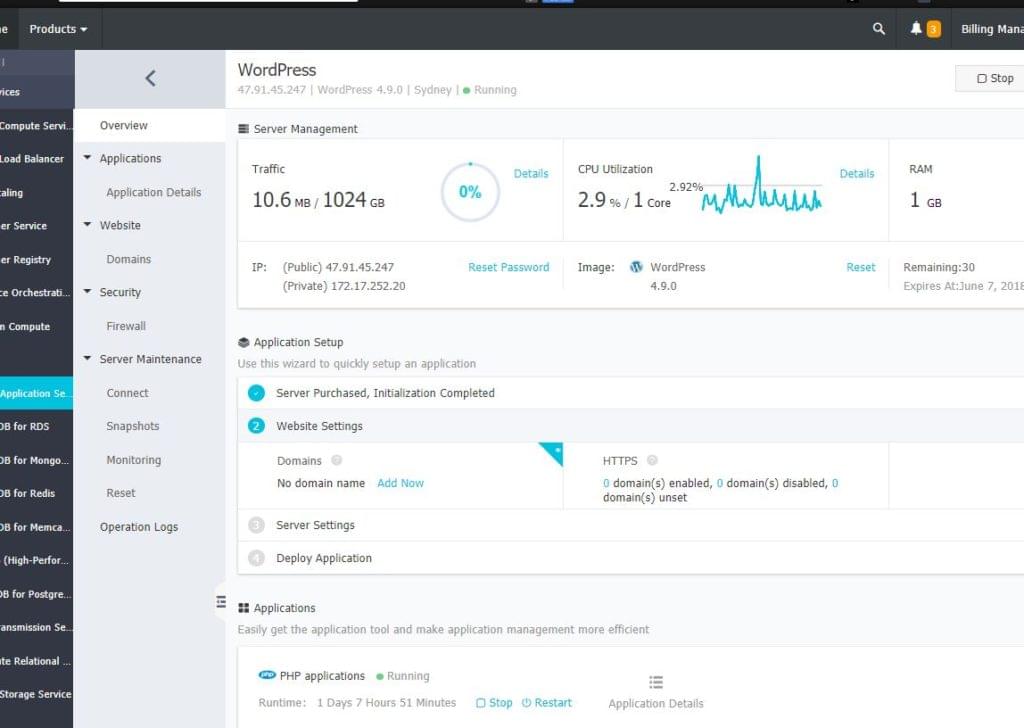
There are plenty of options here, and even not-so technically apt users should have an easy time finding their way around.

The post How to Deploy a WordPress Site on Alibaba Cloud SAS appeared first on SitePoint.


by Tonino Jankov via SitePoint

An Introduction to Geth and Running Ethereum Nodes

In this article, we’ll look at what Ethereum nodes are, and explore one of the most popular ones, called Geth.

In order to communicate with the blockchain, we must use a blockchain client. The client is a piece of software capable of establishing a p2p communication channel with other clients, signing and broadcasting transactions, mining, deploying and interacting with smart contracts, etc. The client is often referred to as a node.

The formal definition of the functionality an Ethereum node must follow is defined in the ethereum yellow paper. The yellow paper defines the required functions of nodes on the network, the mining algorithm, private/public key ECDSA parameters. It defines the entirety of features which make nodes fully compatible Ethereum clients.

Based on the yellow paper, anyone is able to create their own implementation of an Ethereum node in whatever language they see fit.

A full list of clients can be seen here.

The most popular clients so far are Geth and Parity. The implementations differ mostly by the programming language of choice — where Geth uses Golang and Parity uses Rust.

Since Geth is the most popular client implementation currently available, we’ll focus on it for now.

Types of Nodes

When you’re joining the Ethereum network, you have an option of running
various types of nodes. The options currently are:

  • Light node
  • Full node
  • Archive node

An archive node is a special case of a full node, so we won’t go into detail on it. One of the best summaries on the types of nodes I’ve found is on Stack Exchange:

In general, we can divide node software into two types: full nodes and light(weight) nodes. Full nodes verify block that is broadcast onto the network. That is, they ensure that the transactions contained in the blocks (and the blocks themselves) follow the rules defined in the Ethereum specifications. They maintain the current state of the network (as defined according to the Ethereum specifications).

Transactions and blocks that do not follow the rules are not used to determine the current state of the Ethereum network. For example, if A tries to send 100 ether to B but A has 0 ethers and a block includes this transaction, the full nodes will realize this does not follow the rules of Ethereum and reject that block as invalid. In particular, the execution of smart contracts is an example of a transaction. Whenever a smart contract is used in a transaction (e.g., sending ERC-20 tokens), all full nodes will have to run all the instructions to ensure that they arrive at the correct, agreed-upon next state of the blockchain.

There are multiple ways of arriving at the same state. For example, if A had 101 ether and gave a hundred of them to B in one transaction paying 1 ether for gas, the end result would be the same as if A sent 100 transactions of 1 ether each to B paying 0.01 ether per transaction (ignoring who received the transaction fees). To know if B is now allowed to send 100 ether, it is sufficient to know what B’s current balance is. Full nodes that preserve the entire history of transactions are known as full archiving nodes. These must exist on the network for it to be healthy.

Nodes may also opt to discard old data; if B wants to send 100 ether to C, it doesn’t matter how the ether was obtained, only that B’s account contains 100 ether. Light nodes, in contrast, do not verify every block or transaction and may not have a copy of the current blockchain state. They rely on full nodes to provide them with missing details (or simply lack particular functionality). The advantage of light nodes is that they can get up and running much more quickly, can run on more computationally/memory constrained devices, and don’t eat up nearly as much storage. On the downside, there is an element of trust in other nodes (it varies based on client and probabilistic methods/heuristics can be used to reduce risk). Some full clients include features to have faster syncs (e.g., Parity’s warp sync).

The post An Introduction to Geth and Running Ethereum Nodes appeared first on SitePoint.


by Mislav Javor via SitePoint

Debugging JavaScript Projects with VS Code & Chrome Debugger

Debugging JavaScript isn't the most fun aspect of JavaScript programming, but it's a vital skill. This article covers two tools that will help you debug JavaScript like a pro.

Imagine for a moment that the console.log() function did not exist in JavaScript. I'm pretty sure the first question you'd ask yourself would be “How am I ever going to confirm my code is working correctly?”

The answer lies in using debugging tools. For a long time, most developers, including myself, have been using console.log to debug broken code. It’s quick and easy to use. However, things can get finicky at times if you don't know where and what is causing the bug. Often you'll find yourself laying down console.log traps all over your code to see which one will reveal the culprit.

To remedy this, we need to change our habits and start using debugging tools. There are a number of tools available for debugging JavaScript code, such as the Chrome Dev Tools, Node Debugger, Node Inspect and others. In fact, every major browser provides its own tools.

In this this article, we'll look at how to use the debugging facilities provided by Visual Studio Code. We'll also look at how to use the Debugger for Chrome extension that allows VS Code to integrate with Chrome Dev Tools. Once we're finished, you'll never want to use a console.log() again.

Prerequisites

For this tutorial, you only need to have a solid foundation in modern JavaScript. We’ll also look at how we can debug a test written using Mocha and Chai. We'll be using a broken project, debug-example, to learn how to fix various bugs without using a single console.log. You'll need the following to follow along:

Start by cloning the debug-example project to your workspace. Open the project in VS Code and install the dependencies via the integrated terminal:

# Install package dependencies
npm install

# Install global dependencies
npm install -g mocha

Now we're ready to learn how to debug a JavaScript project in VS Code.

Debugging JavaScript in VS Code

The first file I’d like you to look at is src/places.js. You'll need to open the debug-project folder in VS Code (File > Open Folder) and select the file from within the editor.

const places = [];

module.exports = {
  places,

  addPlace: (city, country) => {
    const id = ++places.length;
    let numType = 'odd';
    if (id % 2) {
      numType = 'even';
    }
    places.push({
      id, city, country, numType,
    });
  },
};

The code is pretty simple, and if you have enough experience in coding you might notice it has a couple of bugs. If you do notice them, please ignore them. If not, perfect. Let's add a few of lines at the bottom to manually test the code:

module.exports.addPlace('Mombasa', 'Kenya');
module.exports.addPlace('Kingston', 'Jamaica');
module.exports.addPlace('Cape Town', 'South Africa');

Now, I’m sure you’re itching to do a console.log to output the value of places. But let's not do that. Instead, let's add breakpoints. Simply add them by left-clicking on the gutter — that is, the blank space next to the line numbers:

Red dots indicating breakpoints

See the red dots on the side? Those are the breakpoints. A breakpoint is simply a visual indication telling the debugger tool where to pause execution. Next, on the action bar, click the debug button (the icon that says “No Bugs Allowed”).

The debug panel

Look at the top section. You'll notice there’s a gear icon with a red dot. Simply click on it. A debug configuration file, launch.json, will be created for you. Update the config like this so that you can run VS Code's debugger on places.js:

"configurations": [
  {
    "type": "node",
    "request": "launch",
    "name": "Launch Places",
    "program": "${workspaceFolder}\\src\\places.js"
  }
]

Note: Depending on your operating system, you might have to replace the double backslash (\\) with a single forward slash (/).

After you’ve saved the file, you'll notice that the debug panel has a new dropdown, Launch Places. To run it, you can:

  • hit the Green Play button on the debug panel
  • press F5
  • click Debug > Start Debugging on the menu bar.

Use whatever method you like and observe the debug process in action:

Debug running

A number of things happen in quick succession once you hit the debug button. First, there's a toolbar that appears at the top of the editor. It has the following controls:

  • Drag Dots anchor: for moving the toolbar to somewhere it’s not blocking anything
  • Continue: continue the debugging session
  • Step over: execute code line by line, skipping functions
  • Step into: execute code line by line, going inside functions
  • Step out: if already inside a function, this command will take you out
  • Restart: restarts the debugging session
  • Stop: stops the debugging session.

Right now, you'll notice that the debug session has paused on your first breakpoint. To continue the session, just hit the Continue button, which will cause execution to continue until it reaches the second breakpoint and pause again. Hitting Continue again will complete the execution and the debugging session will complete.

Let's start the debugging process again by hitting F5. Make sure the two breakpoints are still in place. When you place a breakpoint, the code pauses at the specified line. It doesn’t execute that line unless you hit Continue (F5) or Step Over (F10). Before you hit anything, let's take a look at the sections that make up the debug panel:

  • Variables: displays local and global variables within the current scope (i.e. at the point of execution)
  • Watch: you can manually add expressions of variables you want to monitor
  • Call Stack: displays a call stack of the highlighted code
  • Breakpoints: displays a list of files with breakpoints, along with their line numbers.

To add an expression to the Watch section, simply click the + sign and add any valid JavaScript expression — such as places.length. When the debugger pauses, if your expression is in scope, the value will be printed out. You can also hover over variables that are currently in scope. A popup will appear displaying their values.

Currently the places array is empty. Press any navigation control to see how debugging works. For example, Step over will jump into the next line, while Step into will navigate to the addPlace function. Take a bit of time to get familiar with the controls.

As soon as you’ve done some stepping, hover over the places variable. A popup will appear. Expand the values inside until you have a similar view:

The places popup

You can also inspect all variables that are in scope in the Variables section.

The variables section

That's pretty awesome compared to what we normally do with console.log. The debugger allows us to inspect variables at a deeper level. You may have also noticed a couple of problems with the places array output:

  1. there are multiple blanks in the array — that is, places[0] and places[2] are undefined
  2. the numType property displays even for odd id values.

For now, just end the debugging session. We'll fix them in the next section.

The post Debugging JavaScript Projects with VS Code & Chrome Debugger appeared first on SitePoint.


by Michael Wanyoike via SitePoint

Fetching Data in Your React Application