Debugging JavaScript isn't the most fun aspect of JavaScript programming, but it's a vital skill. This article covers two tools that will help you debug JavaScript like a pro.
Imagine for a moment that the console.log() function did not exist in JavaScript. I'm pretty sure the first question you'd ask yourself would be “How am I ever going to confirm my code is working correctly?”
The answer lies in using debugging tools. For a long time, most developers, including myself, have been using console.log to debug broken code. It’s quick and easy to use. However, things can get finicky at times if you don't know where and what is causing the bug. Often you'll find yourself laying down console.log traps all over your code to see which one will reveal the culprit.
To remedy this, we need to change our habits and start using debugging tools. There are a number of tools available for debugging JavaScript code, such as the Chrome Dev Tools, Node Debugger, Node Inspect and others. In fact, every major browser provides its own tools.
In this this article, we'll look at how to use the debugging facilities provided by Visual Studio Code. We'll also look at how to use the Debugger for Chrome extension that allows VS Code to integrate with Chrome Dev Tools. Once we're finished, you'll never want to use a console.log() again.
Prerequisites
For this tutorial, you only need to have a solid foundation in modern JavaScript. We’ll also look at how we can debug a test written using Mocha and Chai. We'll be using a broken project, debug-example, to learn how to fix various bugs without using a single console.log. You'll need the following to follow along:
Start by cloning the debug-example project to your workspace. Open the project in VS Code and install the dependencies via the integrated terminal:
# Install package dependencies
npm install

# Install global dependencies
npm install -g mocha
Now we're ready to learn how to debug a JavaScript project in VS Code.
Debugging JavaScript in VS Code
The first file I’d like you to look at is src/places.js. You'll need to open the debug-project folder in VS Code (File > Open Folder) and select the file from within the editor.
const places = [];

module.exports = {
  places,

  addPlace: (city, country) => {
    const id = ++places.length;
    let numType = 'odd';
    if (id % 2) {
      numType = 'even';
    }
    places.push({
      id, city, country, numType,
    });
  },
};
The code is pretty simple, and if you have enough experience in coding you might notice it has a couple of bugs. If you do notice them, please ignore them. If not, perfect. Let's add a few of lines at the bottom to manually test the code:
module.exports.addPlace('Mombasa', 'Kenya');
module.exports.addPlace('Kingston', 'Jamaica');
module.exports.addPlace('Cape Town', 'South Africa');
Now, I’m sure you’re itching to do a console.log to output the value of places. But let's not do that. Instead, let's add breakpoints. Simply add them by left-clicking on the gutter — that is, the blank space next to the line numbers:
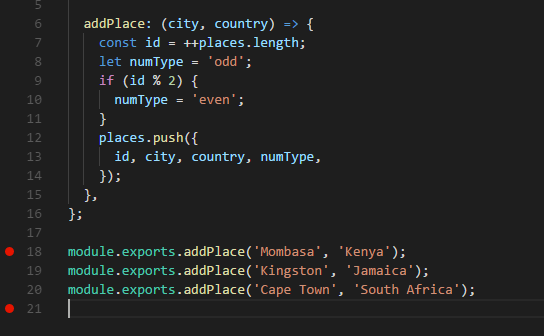
See the red dots on the side? Those are the breakpoints. A breakpoint is simply a visual indication telling the debugger tool where to pause execution. Next, on the action bar, click the debug button (the icon that says “No Bugs Allowed”).
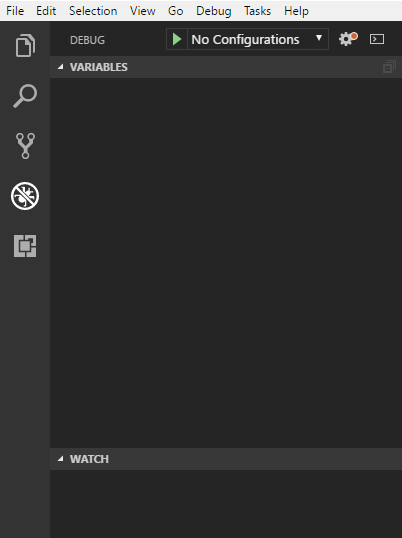
Look at the top section. You'll notice there’s a gear icon with a red dot. Simply click on it. A debug configuration file, launch.json, will be created for you. Update the config like this so that you can run VS Code's debugger on places.js:
"configurations": [
  {
    "type": "node",
    "request": "launch",
    "name": "Launch Places",
    "program": "${workspaceFolder}\\src\\places.js"
  }
]
Note: Depending on your operating system, you might have to replace the double backslash (\\) with a single forward slash (/).
After you’ve saved the file, you'll notice that the debug panel has a new dropdown, Launch Places. To run it, you can:
- hit the Green Play button on the debug panel
- press F5
- click Debug > Start Debugging on the menu bar.
Use whatever method you like and observe the debug process in action:
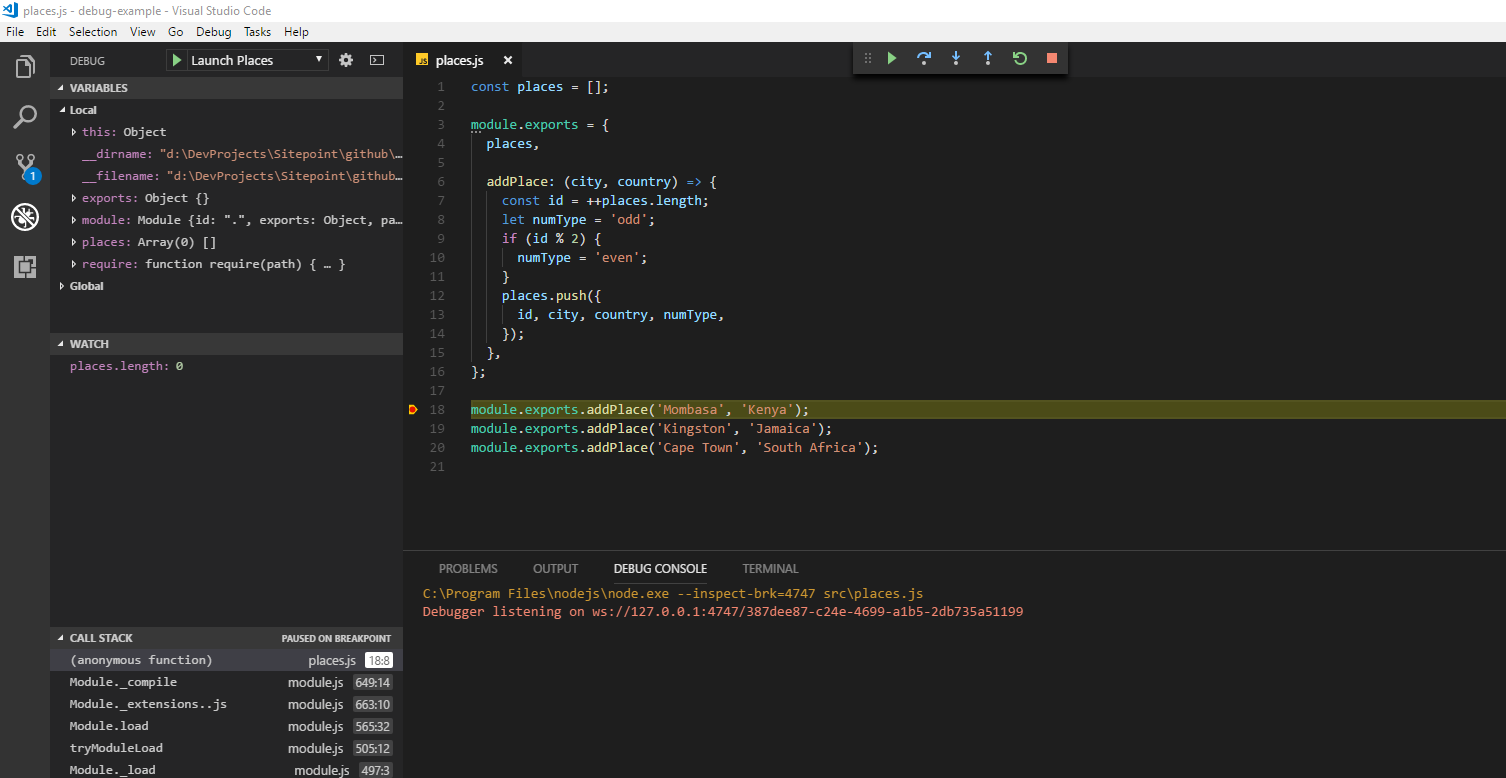
A number of things happen in quick succession once you hit the debug button. First, there's a toolbar that appears at the top of the editor. It has the following controls:
- Drag Dots anchor: for moving the toolbar to somewhere it’s not blocking anything
- Continue: continue the debugging session
- Step over: execute code line by line, skipping functions
- Step into: execute code line by line, going inside functions
- Step out: if already inside a function, this command will take you out
- Restart: restarts the debugging session
- Stop: stops the debugging session.
Right now, you'll notice that the debug session has paused on your first breakpoint. To continue the session, just hit the Continue button, which will cause execution to continue until it reaches the second breakpoint and pause again. Hitting Continue again will complete the execution and the debugging session will complete.
Let's start the debugging process again by hitting F5. Make sure the two breakpoints are still in place. When you place a breakpoint, the code pauses at the specified line. It doesn’t execute that line unless you hit Continue (F5) or Step Over (F10). Before you hit anything, let's take a look at the sections that make up the debug panel:
- Variables: displays local and global variables within the current scope (i.e. at the point of execution)
- Watch: you can manually add expressions of variables you want to monitor
- Call Stack: displays a call stack of the highlighted code
- Breakpoints: displays a list of files with breakpoints, along with their line numbers.
To add an expression to the Watch section, simply click the + sign and add any valid JavaScript expression — such as places.length. When the debugger pauses, if your expression is in scope, the value will be printed out. You can also hover over variables that are currently in scope. A popup will appear displaying their values.
Currently the places array is empty. Press any navigation control to see how debugging works. For example, Step over will jump into the next line, while Step into will navigate to the addPlace function. Take a bit of time to get familiar with the controls.
As soon as you’ve done some stepping, hover over the places variable. A popup will appear. Expand the values inside until you have a similar view:
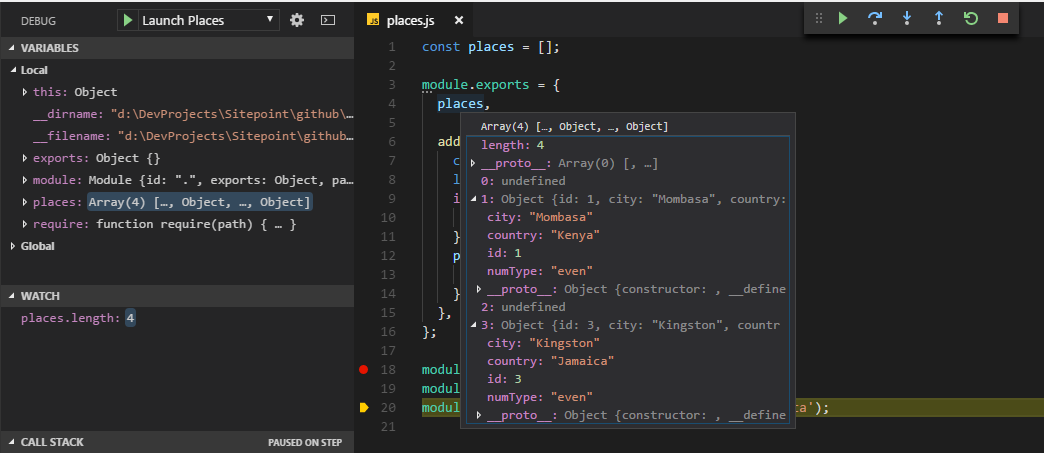
You can also inspect all variables that are in scope in the Variables section.
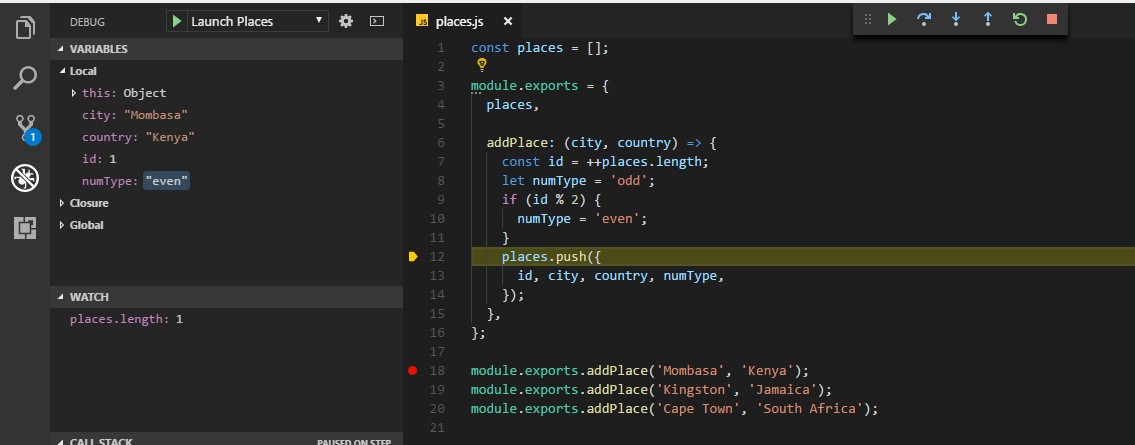
That's pretty awesome compared to what we normally do with console.log. The debugger allows us to inspect variables at a deeper level. You may have also noticed a couple of problems with the places array output:
- there are multiple blanks in the array — that is,
places[0]andplaces[2]areundefined - the
numTypeproperty displaysevenfor oddidvalues.
For now, just end the debugging session. We'll fix them in the next section.
The post Debugging JavaScript Projects with VS Code & Chrome Debugger appeared first on SitePoint.
by Michael Wanyoike via SitePoint
No comments:
Post a Comment