[ This is a content summary only. Visit our website https://ift.tt/1b4YgHQ for full links, other content, and more! ]
by Web Desk via Digital Information World
"Mr Branding" is a blog based on RSS for everything related to website branding and website design, it collects its posts from many sites in order to facilitate the updating to the latest technology.
To suggest any source, please contact me: Taha.baba@consultant.com
Gio.js is an open source library for web 3D globe data visualization built with Three.js.
Gio.js is simple to use to customize a 3D data visualization model in a declarative way, add your own data, and integrate it into your own modern web application
In this article, we'll cover Firefox Web Developer Tools ("DevTools") --- a set of tools designed to help developers inspect, debug, profile and optimize the performance of websites and web applications. We'll particularly look at the tools related to performance, but we'll also see how to get started using DevTools in general, and learn about some useful settings.
You can access DevTools in different ways:
The Firefox DevTools have many options that help developers customize their experience, such as the option to Enable time-stamps in the Web Console, or to Disable HTTP Cache, which is used to simulate first-load performance in all pages that have DevTools open.
You can access the DevTools Settings panel in different ways:
Start by opening DevTools, next:
F1 to show the Settings panel on top of any current tool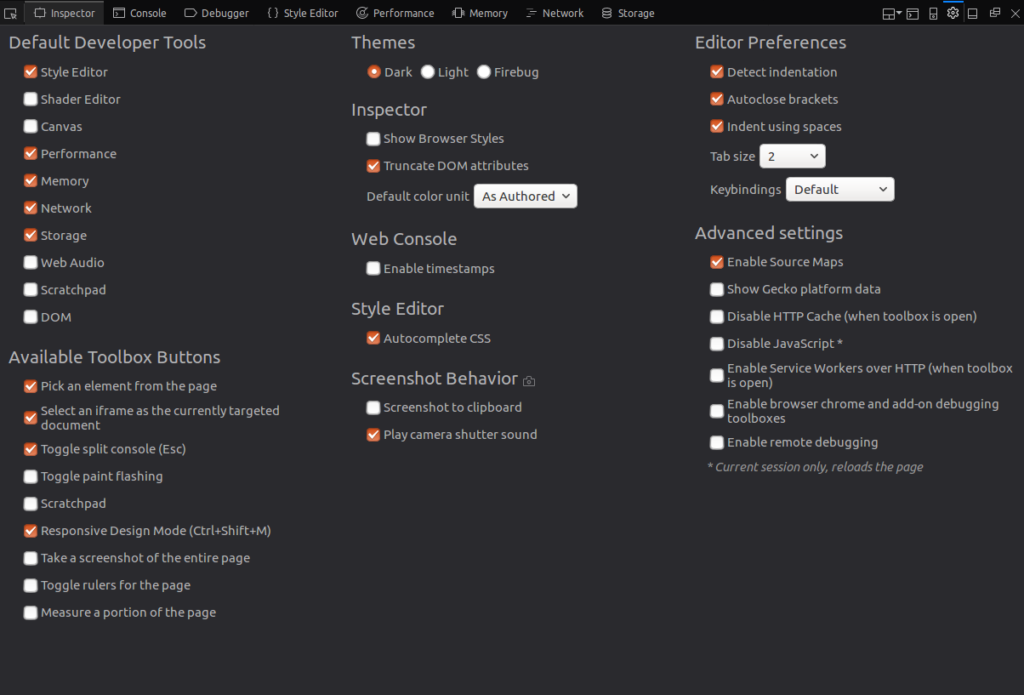
Here you can choose your default tools, the buttons you want to show in the toolbox, themes (dark-light-Firebug) and other advanced settings.
When analyzing the performance of a web application, you need to differentiate between load-time performance and run-time performance.
Load-time performance answers questions like "what resources are taking too much time to load?" When dealing with run-time performance, we need to focus on JavaScript and CSS (CSS animations in particular) so we're able to see where the code spends most of its time and what's causing bottlenecks.
Let's look at the Network Monitor and the Performance Tool.
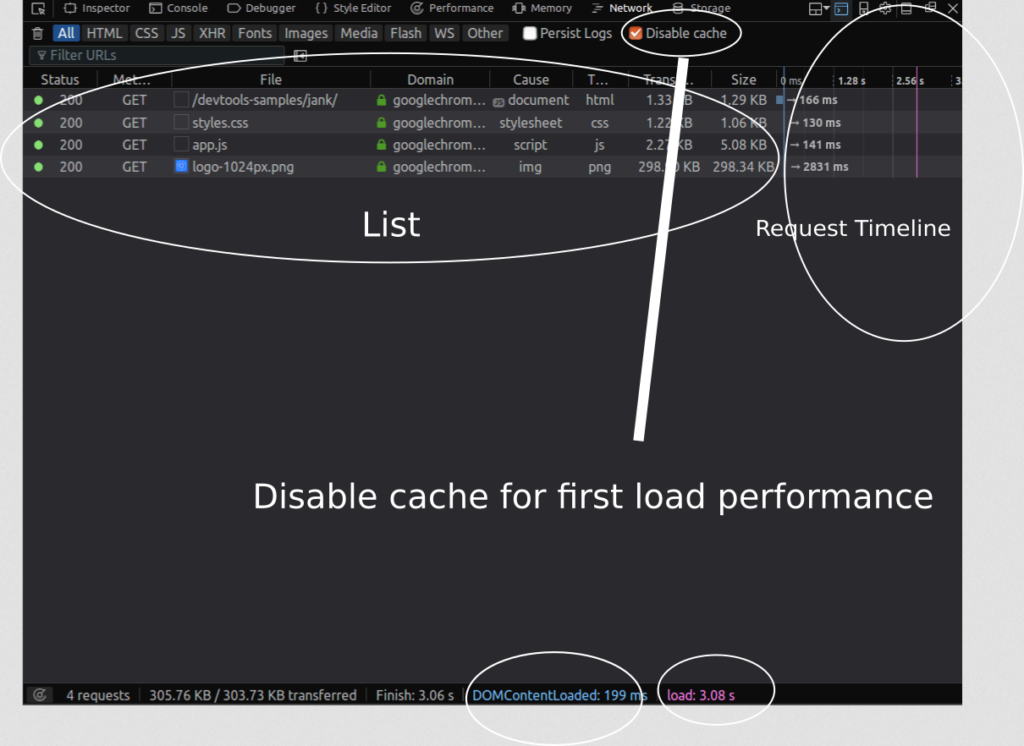
The Network Monitor shows you a tabular view of all network requests that Firefox made (for example, when it's loading a page, or sending XMLHttpRequests, Fetch API requests etc.).
It can also display request-related HTTP headers, HTTP responses and cookies, and let you search through them. You can also use it to perform, display and save a performance analysis of the current page load.
In a nutshell, this tool can be used to determine how long the browser takes to download different assets of a web page.
You can also use this tool to monitor and single out requests that are slowing or blocking the web page's fast loading. The Network panel shows you when principal events are fired (DOMContentLoaded and load).
Each request in the network list has a timeline column which displays timing information related to the request, such as the total time taken to load the resource.
DevTools marks major life-cycle events in the report, like DOMContentLoaded, and page load. The blue refers to the time when the event DOMContentLoaded is fired; the purple line refers to the time when the page's load event is fired.
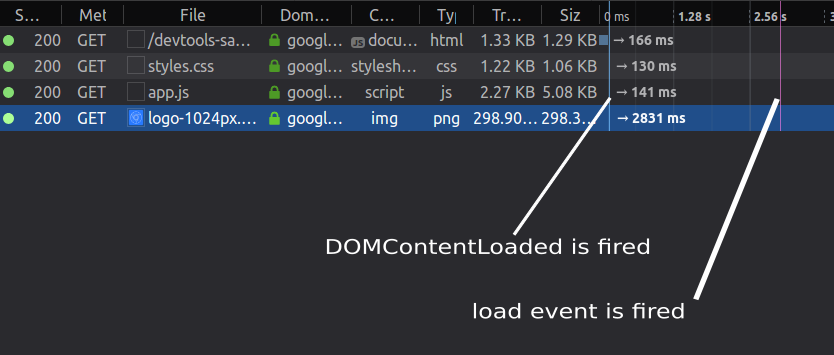
The DOMContentLoaded event fires right when the HTML document is completely loaded and parsed, not including CSS style sheets, images, and frames.
The event load fires when the HTML document and all associated style sheets, images and frames are completely loaded.
Once you click on a request in the requests list, you can a see right-docked details pane which has many different tabs such as headers, params, response, timings and security.
For performance, we'll particularly look at the timing information.
In this pane, there are many timing metrics related to each request:

Blocked is the time spent in a queue waiting for a network connection.
Sending is the time taken for sending the request to the server.
Receiving is the time taken to receive the response from the server or (if it's cached) to read it from the cache.
Waiting is the total time waited by the client before the first byte has been received. In other performance analysis tools like WebPageTest.org or Chrome's DevTools, this is called TTFB or Time to First Byte.
There's also DNS resolution, which is the time taken to resolve the host name of the server, and Connecting, which is the time taken to open a TCP connection.
The Network Monitor integrates a performance analysis tool that can be used to analyze the load-time performance of your web page.
To start analyzing the load-time performance, you can:
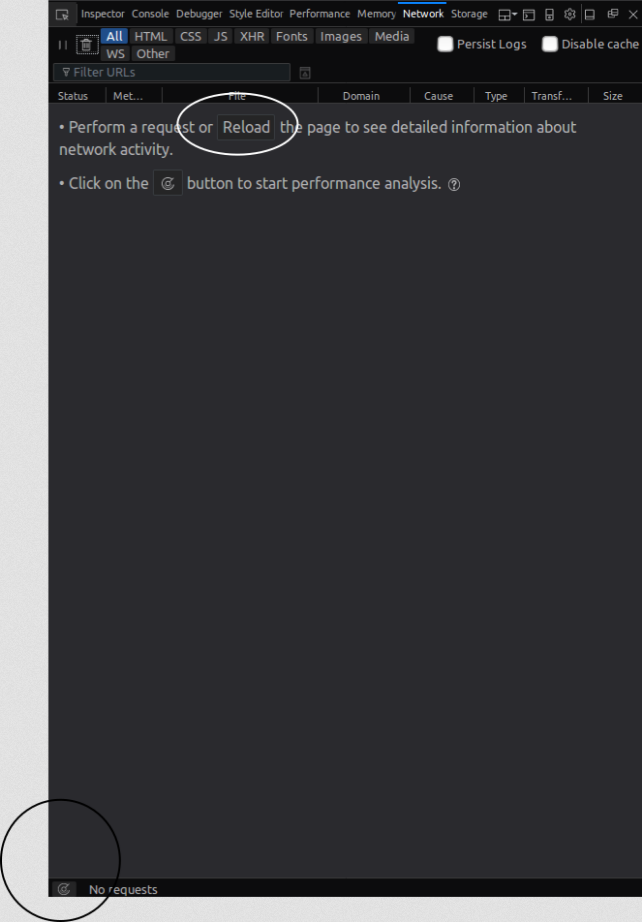
The final report shows a pie chart and a corresponding table for the received resources by types: JavaScript, CSS, images and fonts etc. and a summary with the following details:
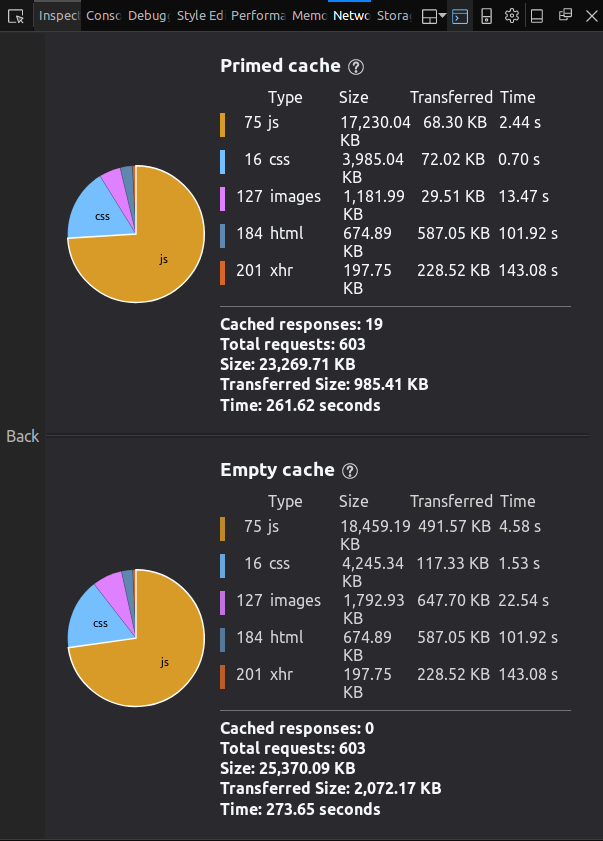
The web page is tested with an empty cache, and with a primed cache.
Firefox's DevTools allow you to analyze the performance of your web application in two different situations:
You can also use the Disable Cache setting to emulate the first-time load of a web page when the DevTools are open on any tab.
The post Performance Auditing: A Firefox Developer Tools Deep Dive appeared first on SitePoint.
We’ve previously written about Geth, one of the most popular Ethereum nodes.
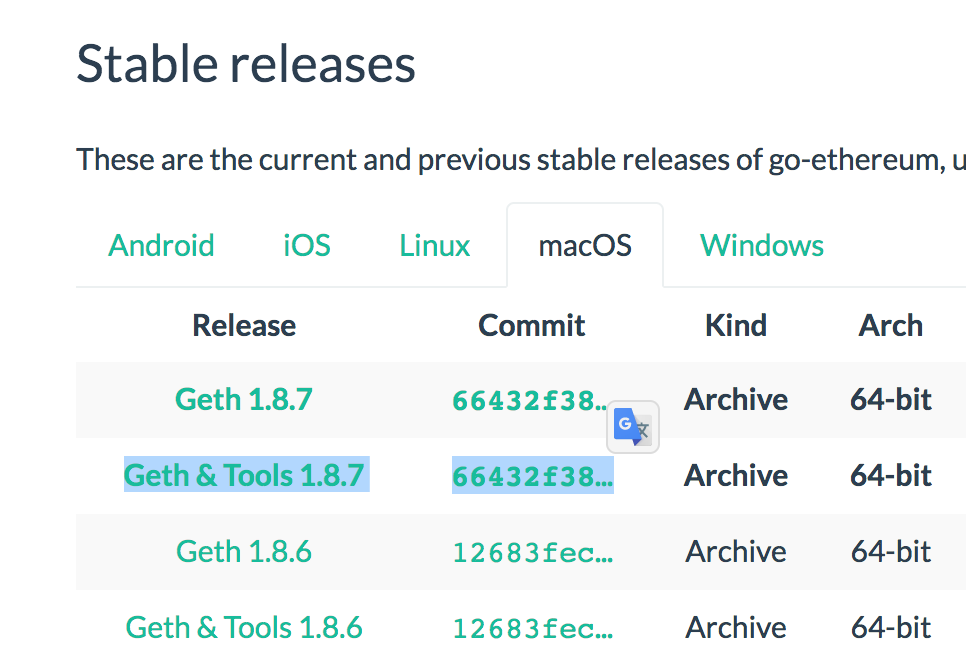
When you install Geth with helper tools, it comes with a handy tool called Puppeth, which you can use to maintain and install various helper tools for managing and deploying your private blockchain. Puppeth can also be installed independently if you have Go installed, with the following command:
go get github.com/ethereum/go-ethereum/cmd/puppeth
Let’s take a look at the tool.
Note: this tutorial will require you to have two remote machines at your disposal. Whether that is a virtual machine like Homestead Improved or an actual server on your network, or a combination of the two, doesn’t matter. We’ll go through the setup procedure with VMs in this tutorial.
Note: due to a bug in Puppeth, this approach might not work if your virtual machines (see below) are too small. Either make bigger VMs (more RAM) or wait for a fix if that’s not an option.
We’ll follow this process to get two virtual machines up and running. We need two machines because we’ll be running two Ethereum nodes, each on its own IP address.
Note: This is a limitation of Puppeth, as it’s not possible to deploy a sealing node on the same machine using this tool.
If you don’t know what Vagrant is, and what tools we’re using here, we recommend you read this introduction to Vagrant, which breaks it down in a newbie-friendly way.
mkdir my_project; cd my_project
git clone https://github.com/swader/homestead_improved hi_puppeth1
git clone https://github.com/swader/homestead_improved hi_puppeth2
Change the IP address of the second clone by going into the hi_puppeth2 folder and modifying the IP address field to be 192.168.10.11 instead of 192.168.10.10.
Next, open up some ports on the VMs by modifying each clone’s Homestead.yaml’s final section, like so:
 ports:
     - send: 8545
       to: 8545
     - send: 30301
       to: 30301
     - send: 30302
       to: 30302
     - send: 30303
       to: 30303
     - send: 30304
       to: 30304
     - send: 30305
       to: 30305
     - send: 30306
       to: 30306
Don’t forget to add these virtual hosts into your host machine’s /etc/hosts file as well. Otherwise the VMs won’t be accessible by their domain name!
192.168.10.10 homestead.test
192.168.10.11 puppethnode.test
Note: change the IP addresses if the addresses of your VMs differ.
Finally, run vagrant up; vagrant ssh to boot each machine and SSH into it. Remember to run this from two separate tabs so you can keep both machines open and running.
Now let’s install the prerequisite software on each machine.
Puppeth runs helper applications and Ethereum nodes for you in Docker containers, so we need Docker. It’s also useful to install Geth itself.
sudo add-apt-repository -y ppa:ethereum/ethereum
sudo apt-get update
sudo apt-get install \
    apt-transport-https \
    ca-certificates \
    curl \
    software-properties-common \
    ethereum \
    docker.io \
    docker-compose
All other prerequisites will be pulled in by Puppeth through docker itself, but we need to make sure the current user is allowed to operate Docker commands first:
sudo usermod -a -G docker $USER
On the host machine (outside the VMs), we should create new Ethereum accounts in the folder where we’re running our project.
If you’re using the VMs as suggested above, that can be in myproject if myproject is the parent folder which contains hi_puppeth1 and hi_puppeth2.
mkdir node1 node2
geth --datadir node1 account new
geth --datadir node2 account new
Make a note of the addresses generated by this process:
$ mkdir node1 node2
$ geth --datadir node1 account new
INFO [05-20|10:27:20] Maximum peer count                       ETH=25 LES=0 total=25
Your new account is locked with a password. Please give a password. Do not forget this password.
Passphrase:
Repeat passphrase:
Address: {aba88be2dc16eaed464e3991eed5a1eaa5e7b11b}
$ geth --datadir node2 account new
INFO [05-20|10:27:35] Maximum peer count                       ETH=25 LES=0 total=25
Your new account is locked with a password. Please give a password. Do not forget this password.
Passphrase:
Repeat passphrase:
Address: {655a6ea9950cdf9f8a8175fda639555f17277bdf}
We need two accounts because at least two signers are needed in a Proof of Authority blockchain (more on that later).
Now that our VMs are running and our accounts are initialized, let’s see what Puppeth offers. With the remote servers/VMs still running, in a new tab on your host machine run Puppeth with puppeth.
The first thing it’ll ask for is the network name. This is useful for identifying various blockchains if you’re running several on your local machine. We’ll use “puptest” here.
Please specify a network name to administer (no spaces or hyphens, please)
> puptest

Sweet, you can set this via --network=puptest next time!

INFO [05-20|10:32:15] Administering Ethereum network           name=puptest
WARN [05-20|10:32:15] No previous configurations found         path=/Users/swader/.puppeth/puptest
Now let’s connect to our “remote” servers so that Puppeth has them in the list and can do operations on them.
The post Using Puppeth, the Ethereum Private Network Manager appeared first on SitePoint.
Clean Landing Page for the Care Cards web app, launched via the “Let’s Go” button.